Fig. C.1
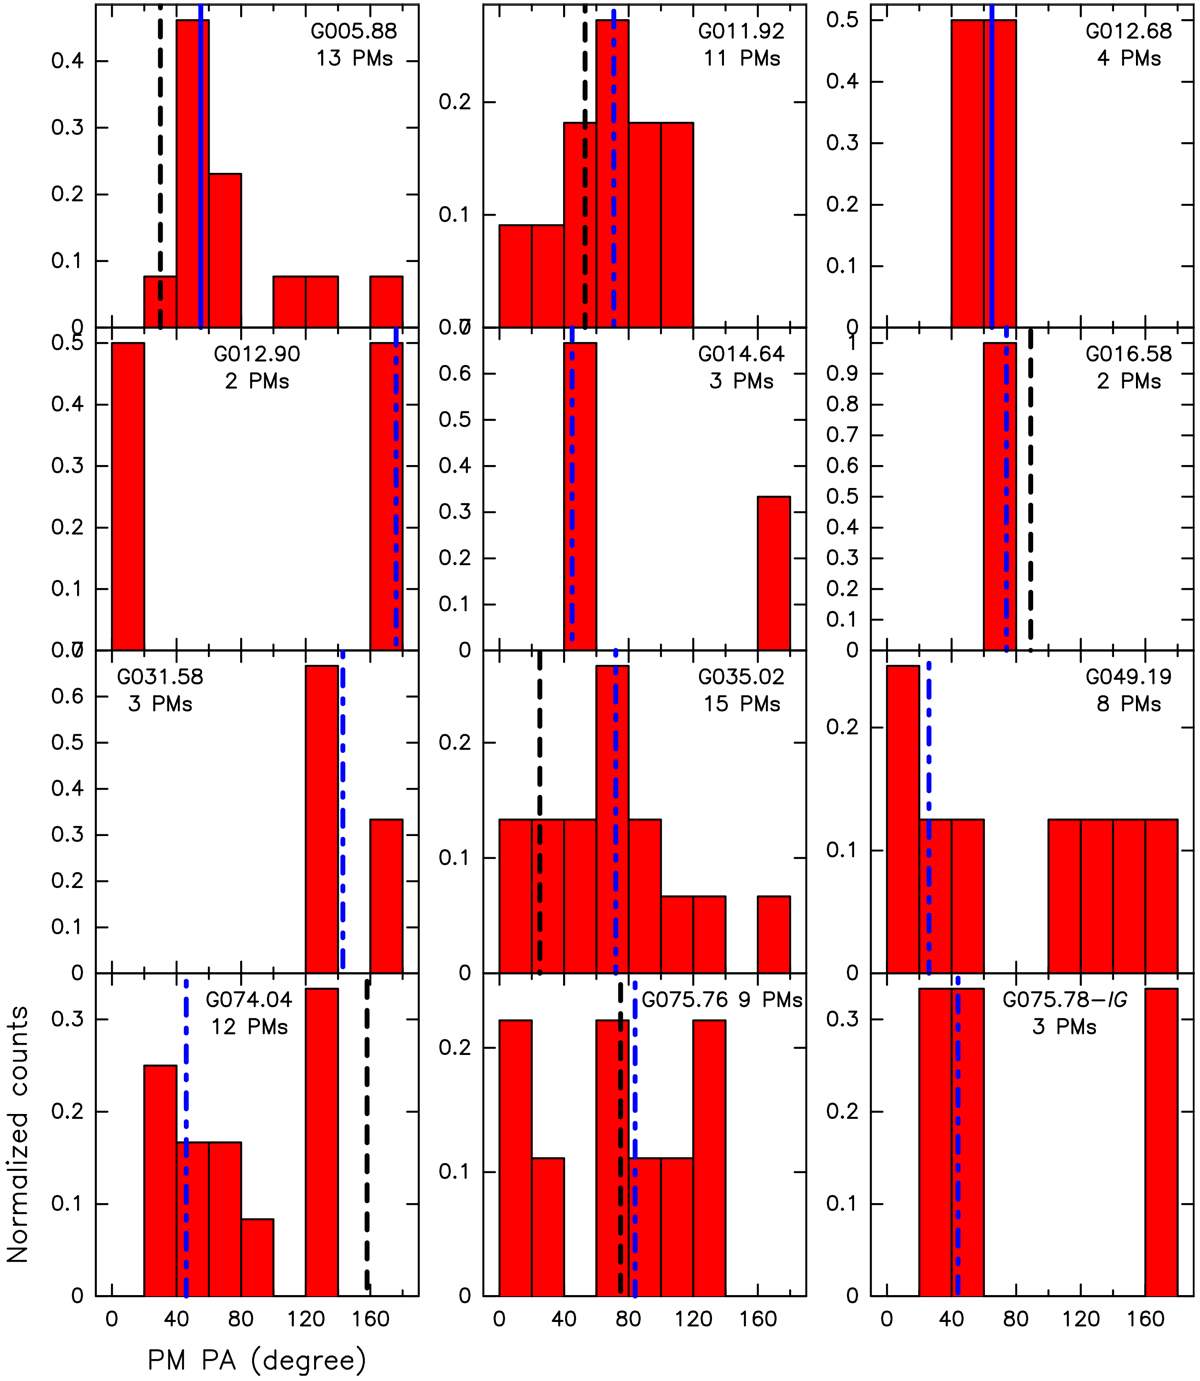
Each plot shows the histogram of the PM PA (0° ≤ PA ≤ 180°) for a specific POETS target, whose name is reported on the top together with the number of PMs employed to produce the histogram. The histogram bin is 20° and the histogram values are normalized by the number of PMs. The average error on the PM PA is ≤10° for most of the sources. The vertical blue line marks the PA of the preferential direction of the water maser PMs, PDPM (see Sect. 2.4), using filled or dot-dashed lines for more or less collimated cases, respectively. In sources where the presence of a jet has been established through observations of thermal line or continuum tracers, the jet PA from the literature, ALJ, is denoted by a vertical black dashed line.
Current usage metrics show cumulative count of Article Views (full-text article views including HTML views, PDF and ePub downloads, according to the available data) and Abstracts Views on Vision4Press platform.
Data correspond to usage on the plateform after 2015. The current usage metrics is available 48-96 hours after online publication and is updated daily on week days.
Initial download of the metrics may take a while.