Fig. B.7
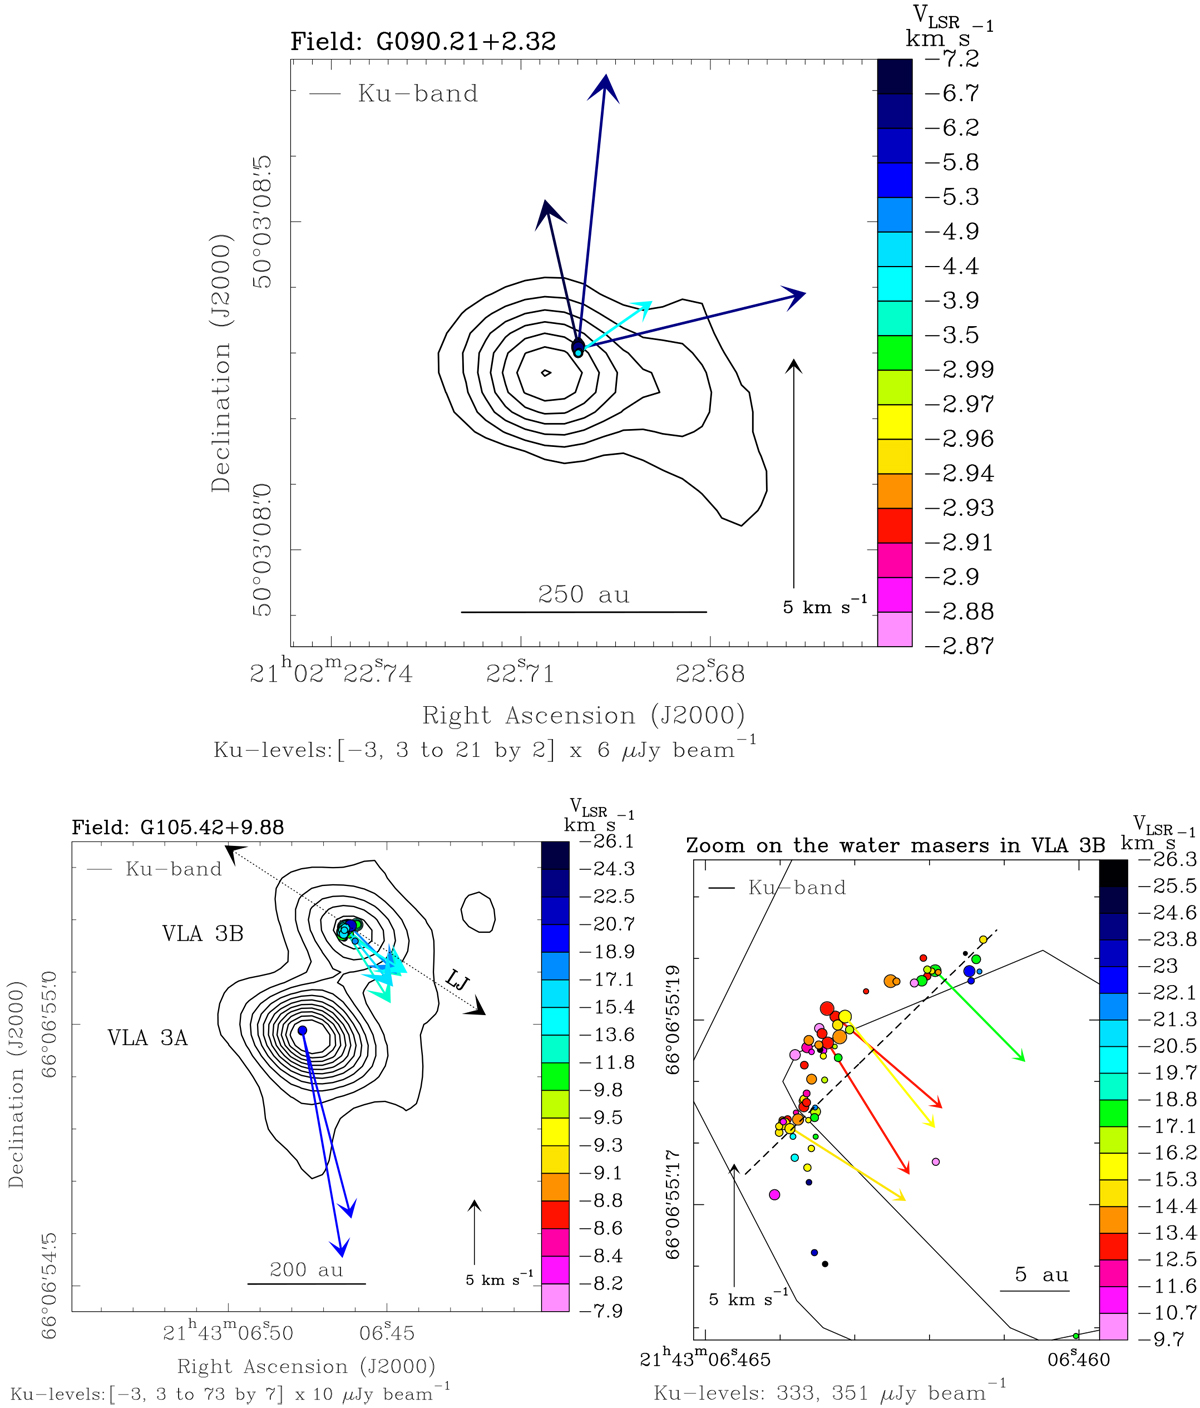
Overlay of radio continuum and water maser positions and velocities. Each panel refers to the POETS target indicated in the observed field above the corresponding plot. In each panel, black contours, and colored dots and arrows have the same meaning as in the upper panel of Fig. 1. Lower panels: large view (left) and zoom on the water maser kinematics near the YSO VLA 3B (right) for the source G105.42+9.88. The VLSR scale of the left and right panels is different. The black dotted arrows labeled LJ in the left panel denote the axis of the radio jet observedwith the VLA by Trinidad et al. (2004). The major-axis of the spatial distribution of the water masers is indicated bya black dashed line in the right panel.
Current usage metrics show cumulative count of Article Views (full-text article views including HTML views, PDF and ePub downloads, according to the available data) and Abstracts Views on Vision4Press platform.
Data correspond to usage on the plateform after 2015. The current usage metrics is available 48-96 hours after online publication and is updated daily on week days.
Initial download of the metrics may take a while.