Free Access
Fig. B.6
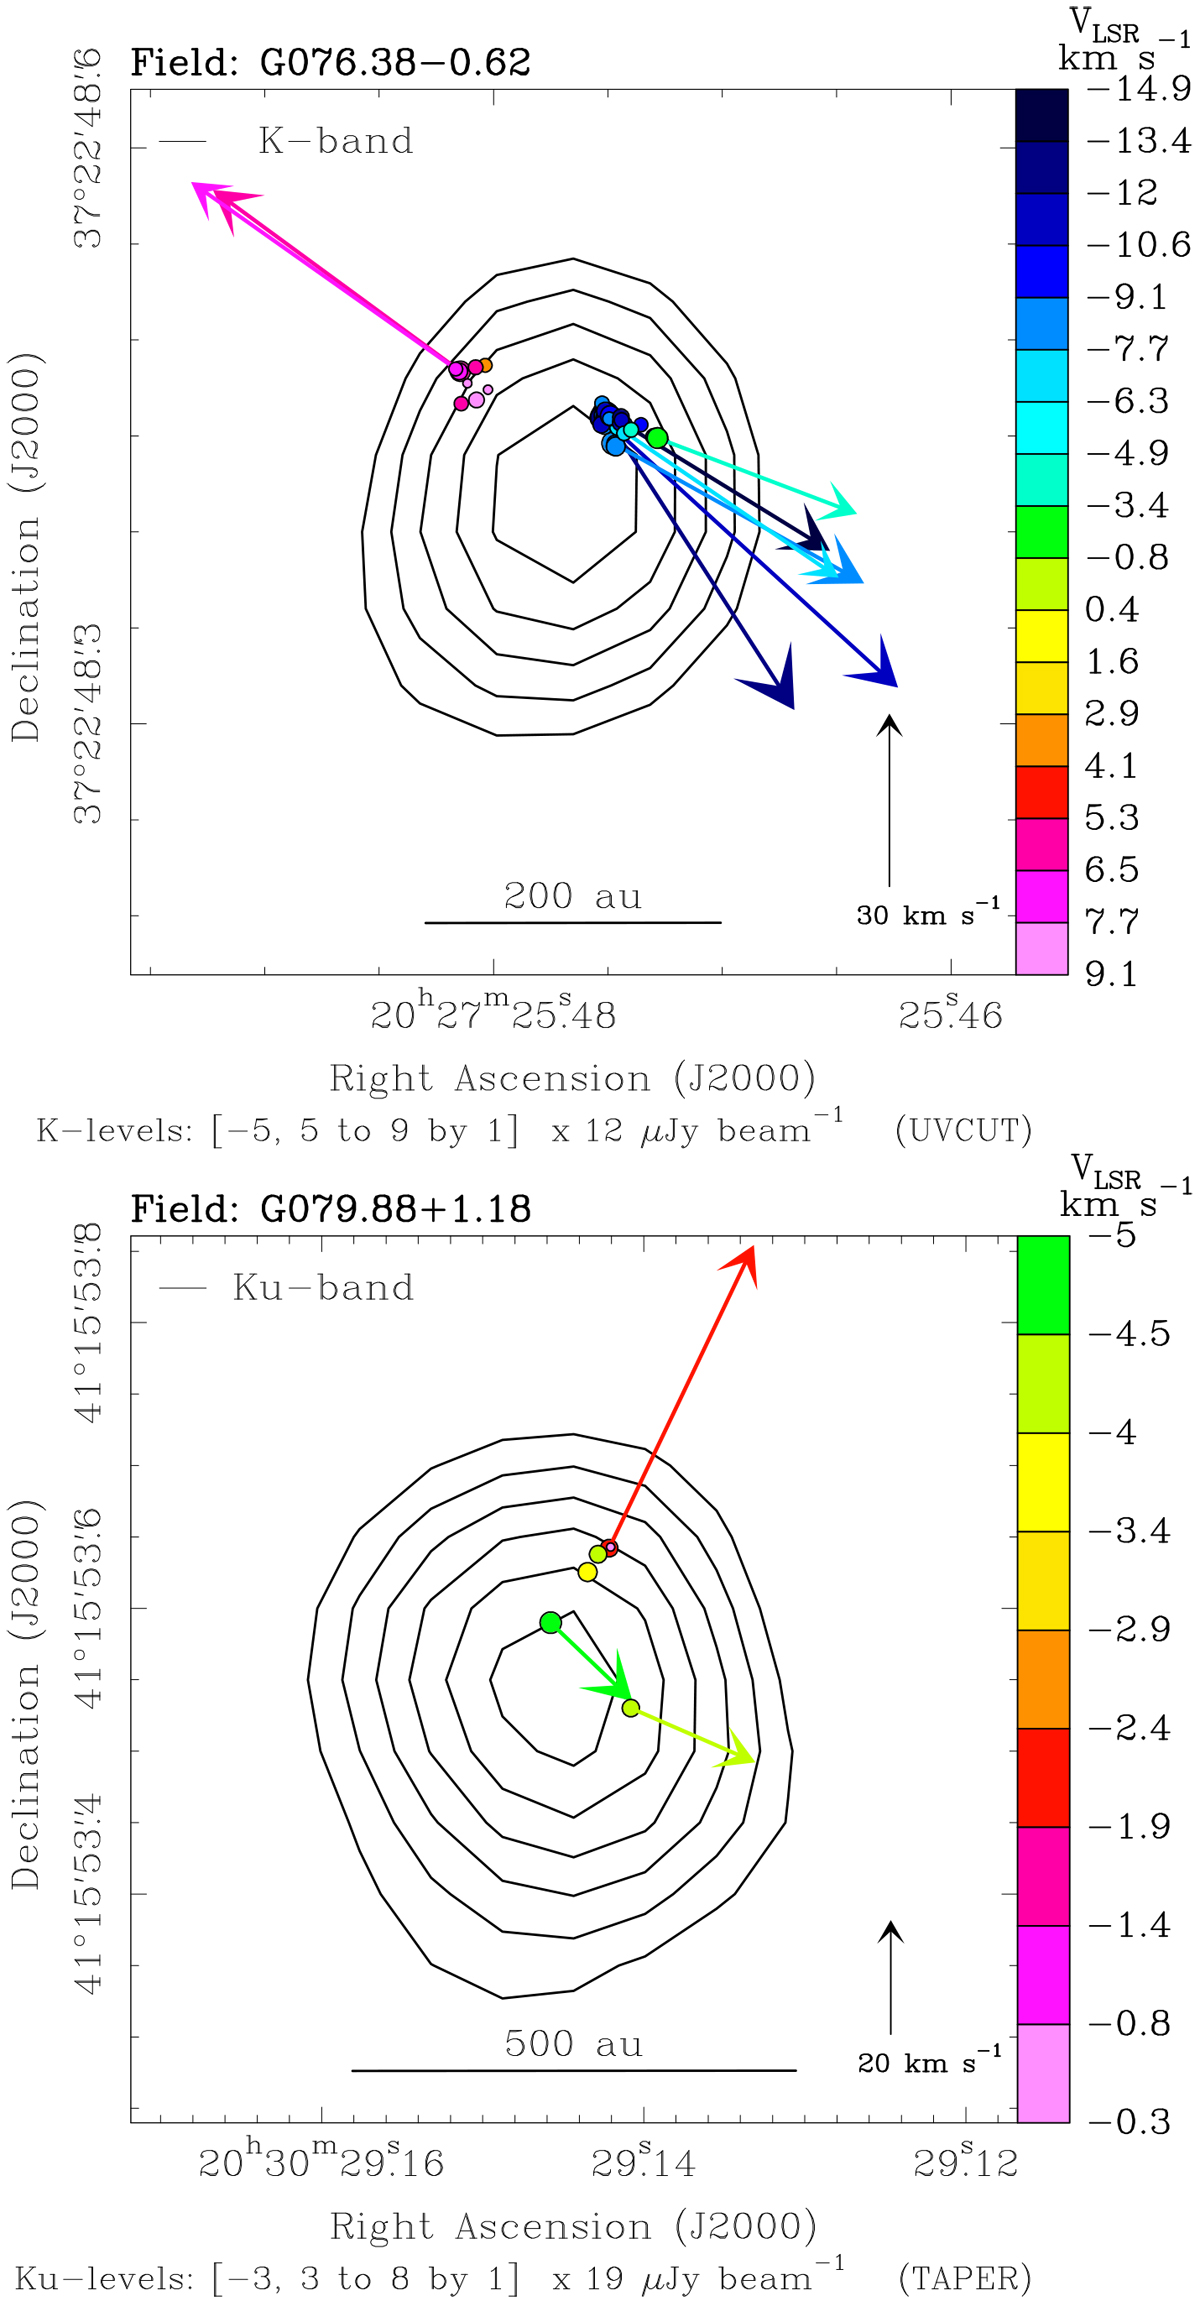
Overlay of radio continuum and water maser positions and velocities. Each panel refers to the POETS target indicated in the observed field above the corresponding plot. In each panel, black contours, and colored dots and arrows have the same meaning as in the upper panel of Fig. 1.
Current usage metrics show cumulative count of Article Views (full-text article views including HTML views, PDF and ePub downloads, according to the available data) and Abstracts Views on Vision4Press platform.
Data correspond to usage on the plateform after 2015. The current usage metrics is available 48-96 hours after online publication and is updated daily on week days.
Initial download of the metrics may take a while.