Fig. 1
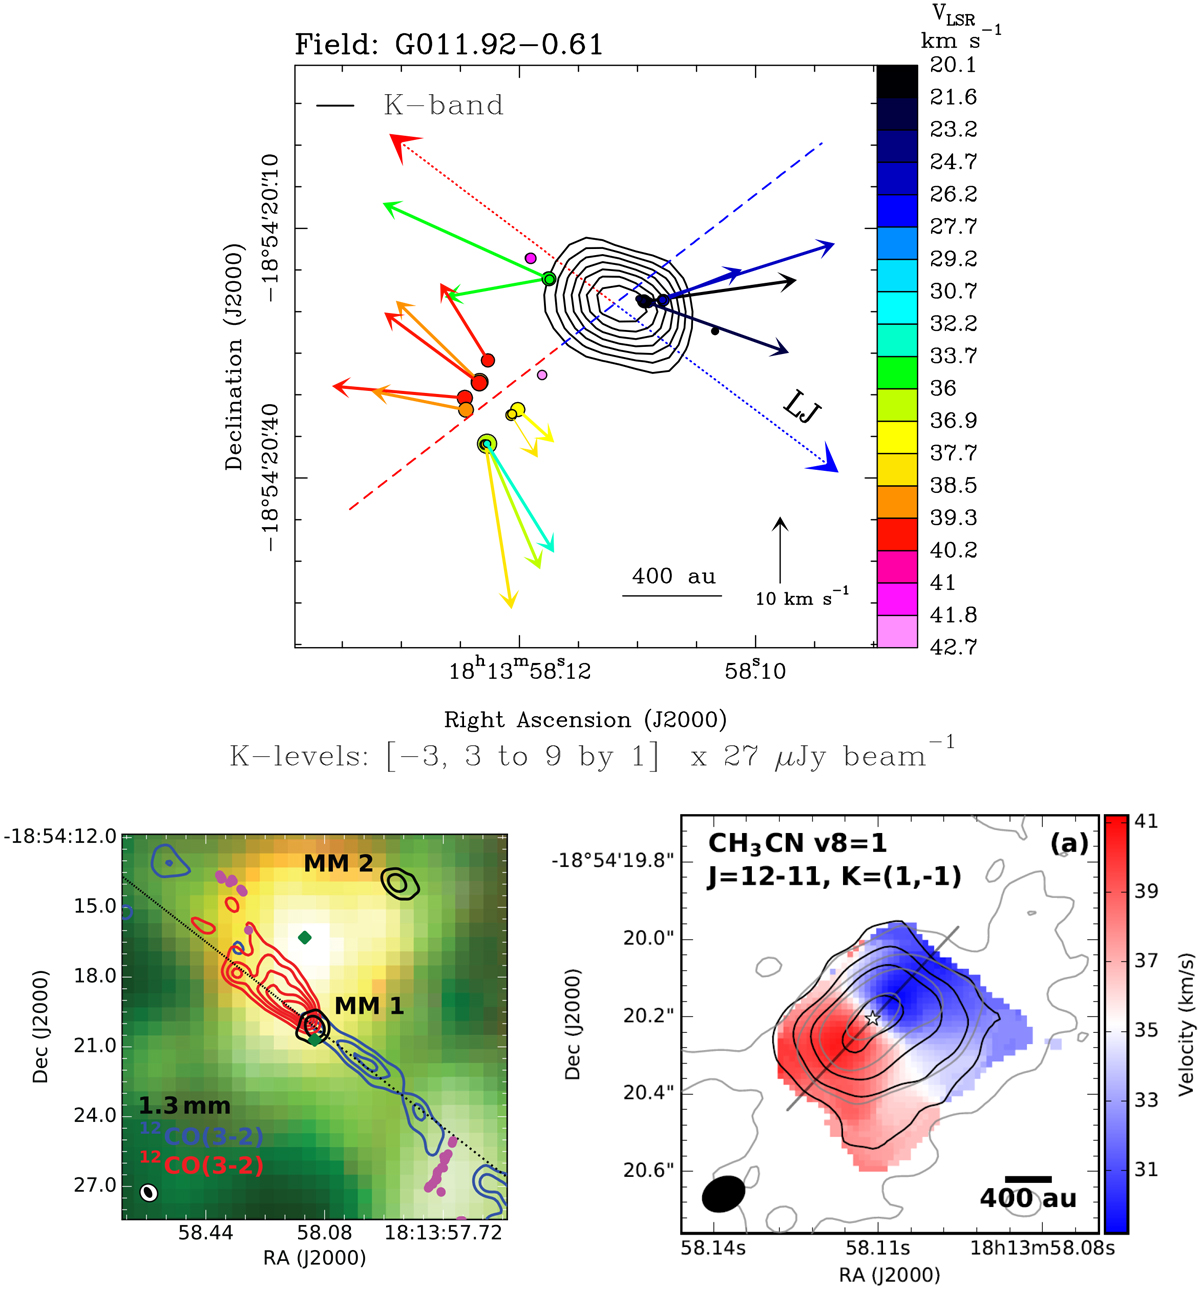
Comparison of gas kinematics traced with water masers and thermal emission for source G011.92−0.61. Upper panel: water maser absolute positions (colored dots) and PMs (colored arrows) overlaid on the JVLA Ku- or K-band (as indicated in the top-left corner) continuum map (black contours). Colors denote the maser VLSR as coded in the wedge on the right side. The dot size scales logarithmically with the maser intensity. All the plotted PMs have S∕N ≥ 3, and their amplitude scale is given on the bottom. The plotted contours of the JVLA continuum are reported below the plot. The VLSR gradient traced by the water masers is indicated by a dashed line, using colors to denote the red- and blue-shifted side of the gradient. The dotted arrows labeled LJ give the axis of the collimated 12CO outflow observed with the SMA by Cyganowski et al. (2011), using colors to distinguish the red- and blue-shifted flow lobe. Bottom-left panel: adapted from Fig. 1 by Ilee et al. (2016). SMA 1.3 mm continuum (black contours) and blue/red-shifted 12CO (3–2) emission. The outflow PA is indicated by the dotted black line. Bottom-right panel: reproduced from Fig. 2 of Ilee et al. (2018) by permission of the American Astronomical Society. Integrated intensity (black contours) and intensity-weighted velocity (colorscale) for the CH3 CN v8 = 1 J = 12−11 (K = 1,−1) line observed with ALMA by Ilee et al. (2018). The continuous black segment denotes the PA of the VLSR gradient in the CH3CN v8 = 1 line.
Current usage metrics show cumulative count of Article Views (full-text article views including HTML views, PDF and ePub downloads, according to the available data) and Abstracts Views on Vision4Press platform.
Data correspond to usage on the plateform after 2015. The current usage metrics is available 48-96 hours after online publication and is updated daily on week days.
Initial download of the metrics may take a while.