Fig. 1.
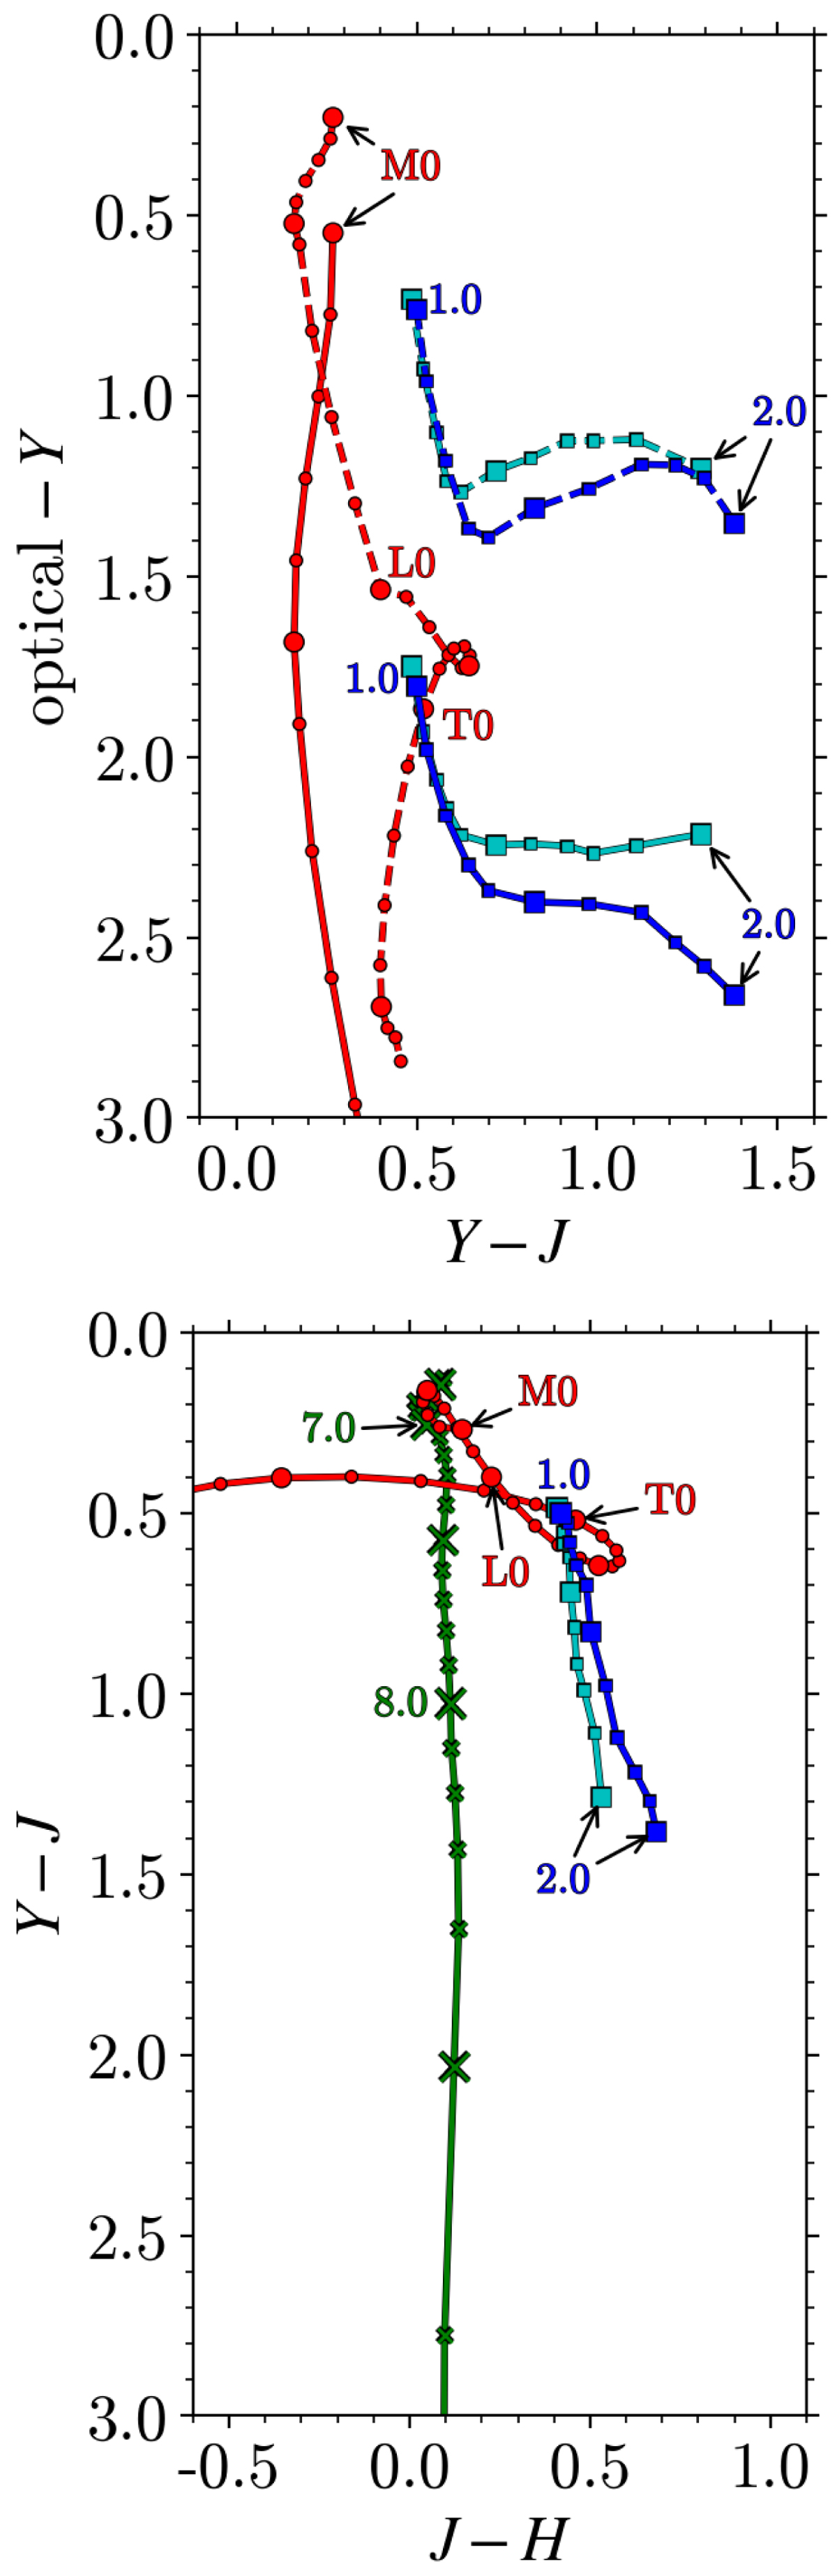
Model colour tracks of relevant populations. We describe the population modelling in Sect. 3.2. The separate populations are indicated as follows. The red tracks with circles show model MLT colours for each spectral type. The blue tracks with squares indicate early-type elliptical populations with two formation redshifts (zf = 3, light blue; and zf = 10, dark blue), with spacing Δz = 0.1, and redshift labels. The green track with crosses indicates quasar model colours, with spacing Δz = 0.1, and redshift labels. Upper: optical-YJ colours. z > 7 quasars are expected to have negligible flux in both O and z, so would appear below the bottom of the plot. We present separate tracks for the two optical bands. Solid lines indicate where the Euclid O band is used in the optical. Dashed lines indicate where the ground-based z band is used in the optical instead. Lower: Euclid YJH colours.
Current usage metrics show cumulative count of Article Views (full-text article views including HTML views, PDF and ePub downloads, according to the available data) and Abstracts Views on Vision4Press platform.
Data correspond to usage on the plateform after 2015. The current usage metrics is available 48-96 hours after online publication and is updated daily on week days.
Initial download of the metrics may take a while.