Fig. 9.
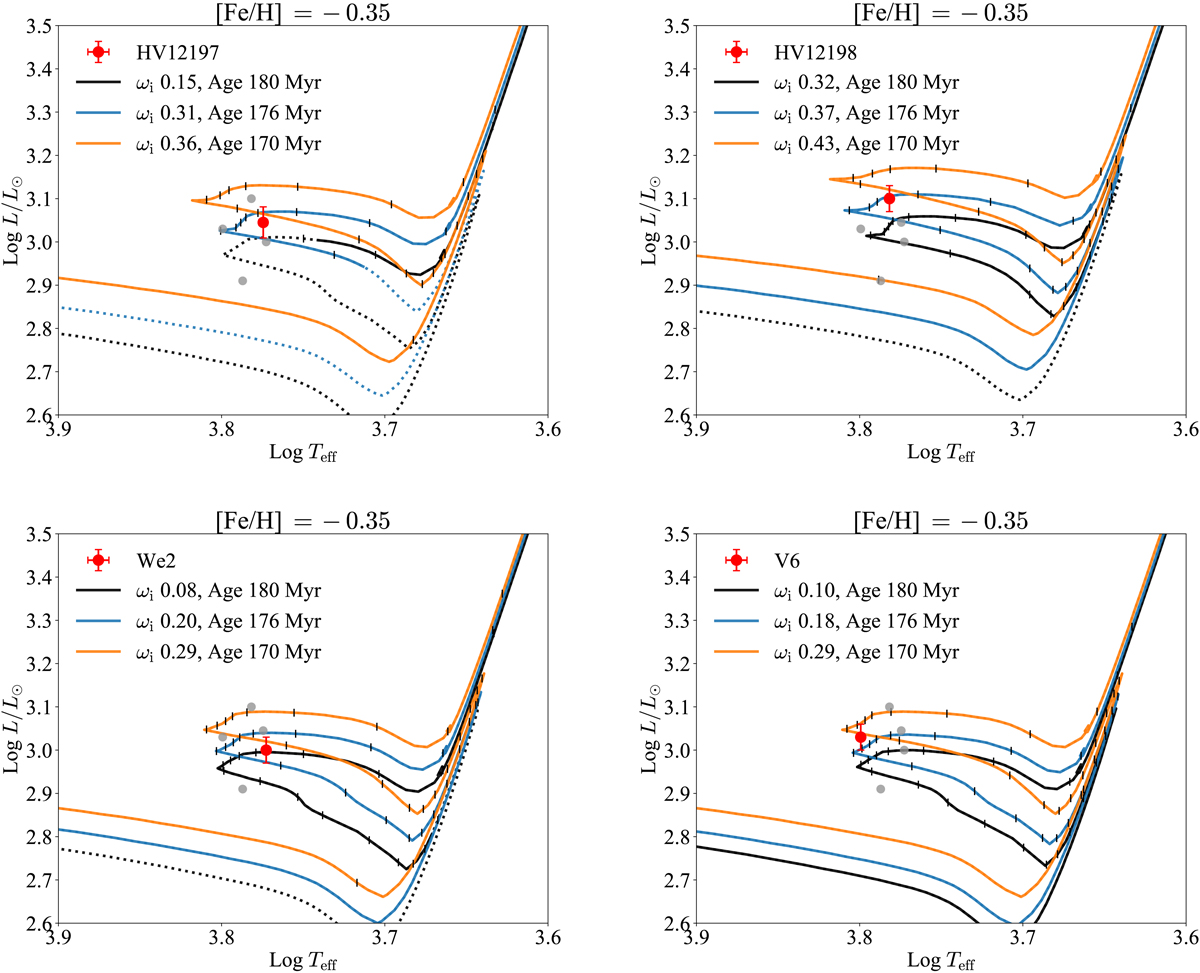
Comparison between the Cepheids data and isochrones selected from the best values obtained from the Bayesian analysis. In each panel the red point with the error bars indicate the selected Cepheid; the grey points indicate the other stars. The error bars are plotted using 3σ. The blue isochrone represents the best-fitted values from the analysis; age and ωi are indicated in Table 2. The black and orange lines are the most and less luminous isochrones within the CIs, respectively. The continuous lines indicate the mass within 3σ of the errors in Table 1; the dotted lines indicate the part of the isochrones with a mass that is outside the 3σ interval. To highlight the different evolutionary speed along isochrones, we plot black vertical markers at intervals of ΔM = 0.01 M⊙.
Current usage metrics show cumulative count of Article Views (full-text article views including HTML views, PDF and ePub downloads, according to the available data) and Abstracts Views on Vision4Press platform.
Data correspond to usage on the plateform after 2015. The current usage metrics is available 48-96 hours after online publication and is updated daily on week days.
Initial download of the metrics may take a while.