Fig. 8.
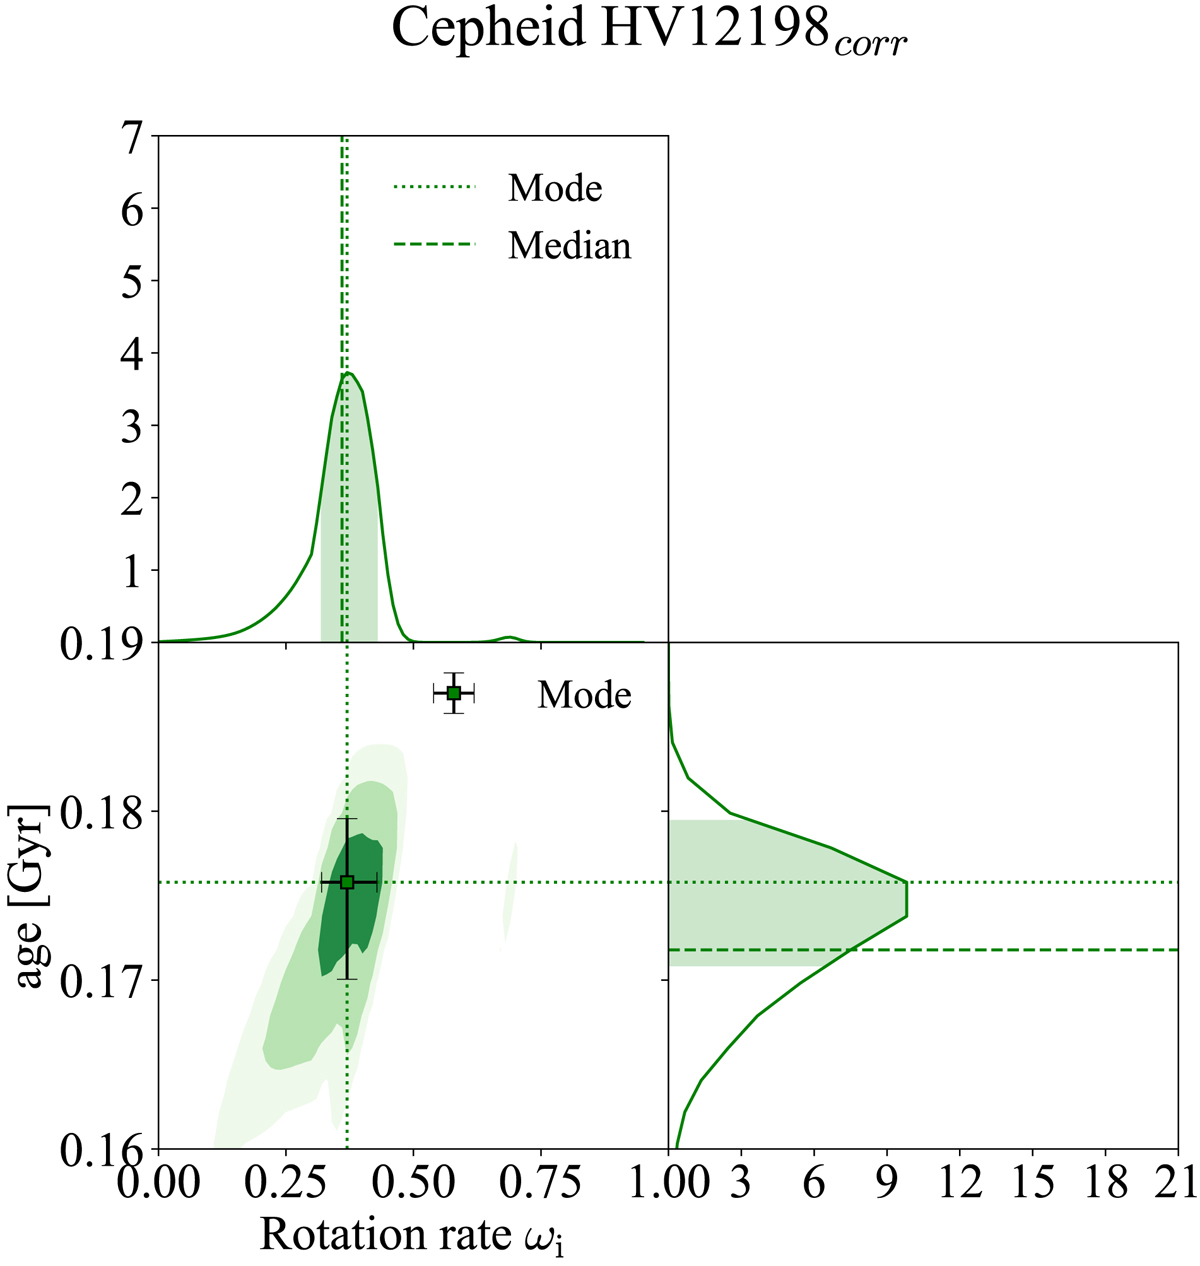
Example of selected 2D-cJPDF as a function of age and ωi for the Cepheid HV 12198. Left-hand bottom panel: cJPDF; left-hand top and right-hand bottom panels: marginalized 1D-PDF of ωi and age, respectively. The square and error bars in the left-hand bottom panel indicate the mode and the CIs. The coloured contours indicate different levels of the JPDF as indicated in the text. The dashed and dotted lines are the mode and median of the distributions. The shaded areas in the marginalized plots indicate the 68 per cent CI of the two PDFs.
Current usage metrics show cumulative count of Article Views (full-text article views including HTML views, PDF and ePub downloads, according to the available data) and Abstracts Views on Vision4Press platform.
Data correspond to usage on the plateform after 2015. The current usage metrics is available 48-96 hours after online publication and is updated daily on week days.
Initial download of the metrics may take a while.