Fig. 5.
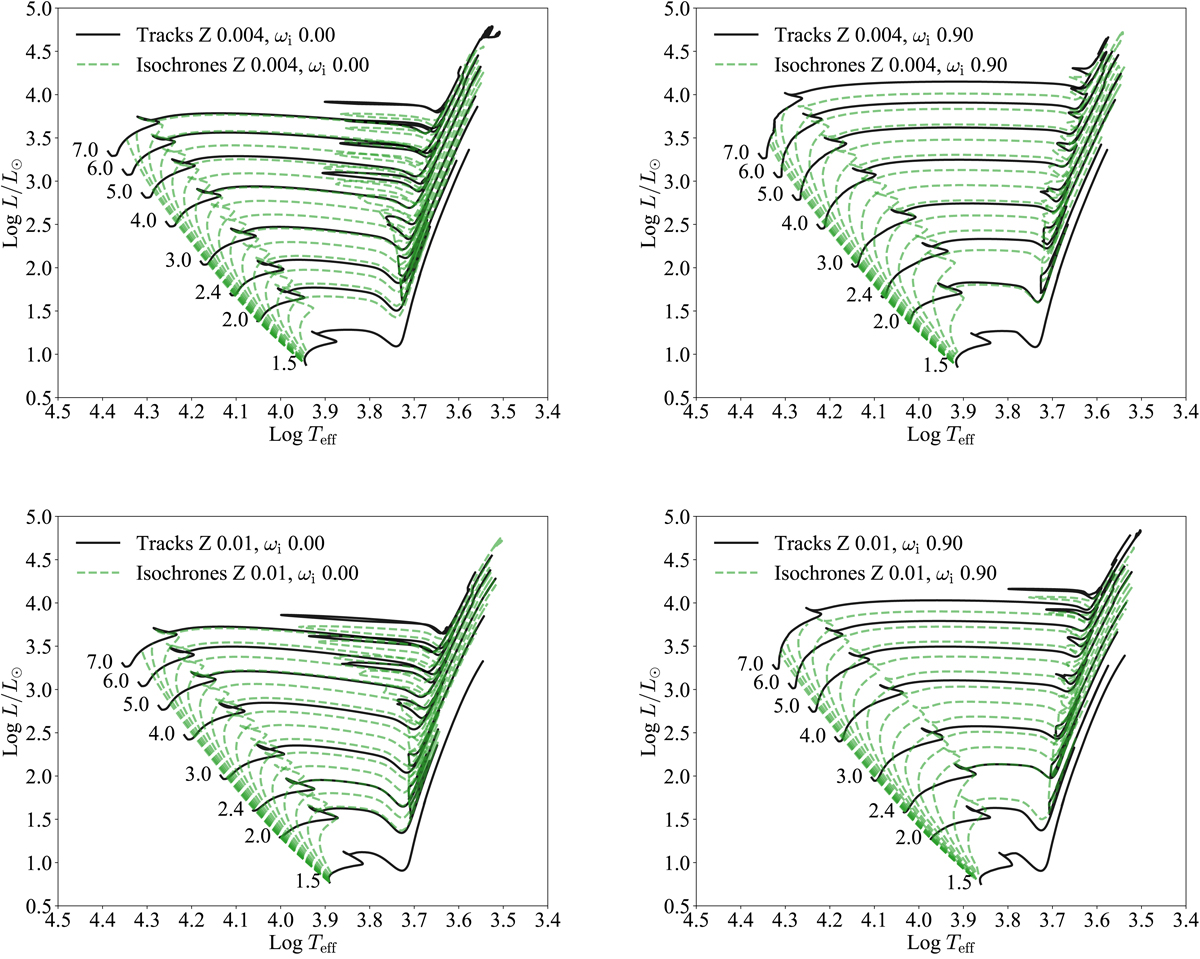
Selected evolutionary tracks (black solid lines) over-plotted with the corresponding isochrones (green dashed lines) used in this work. Left-hand column panels: tracks with ωi = 0.0, while right-hand column panels: tracks with ωi = 0.90. Top row panels: tracks with Z = 0.004 and bottom panel: tracks for Z = 0.01. The tracks cover the mass range from 1.5 to 7 M⊙. The isochrones are equally spaced in logt and cover the age range from 30 to 980 Myr.
Current usage metrics show cumulative count of Article Views (full-text article views including HTML views, PDF and ePub downloads, according to the available data) and Abstracts Views on Vision4Press platform.
Data correspond to usage on the plateform after 2015. The current usage metrics is available 48-96 hours after online publication and is updated daily on week days.
Initial download of the metrics may take a while.