Fig. 2.
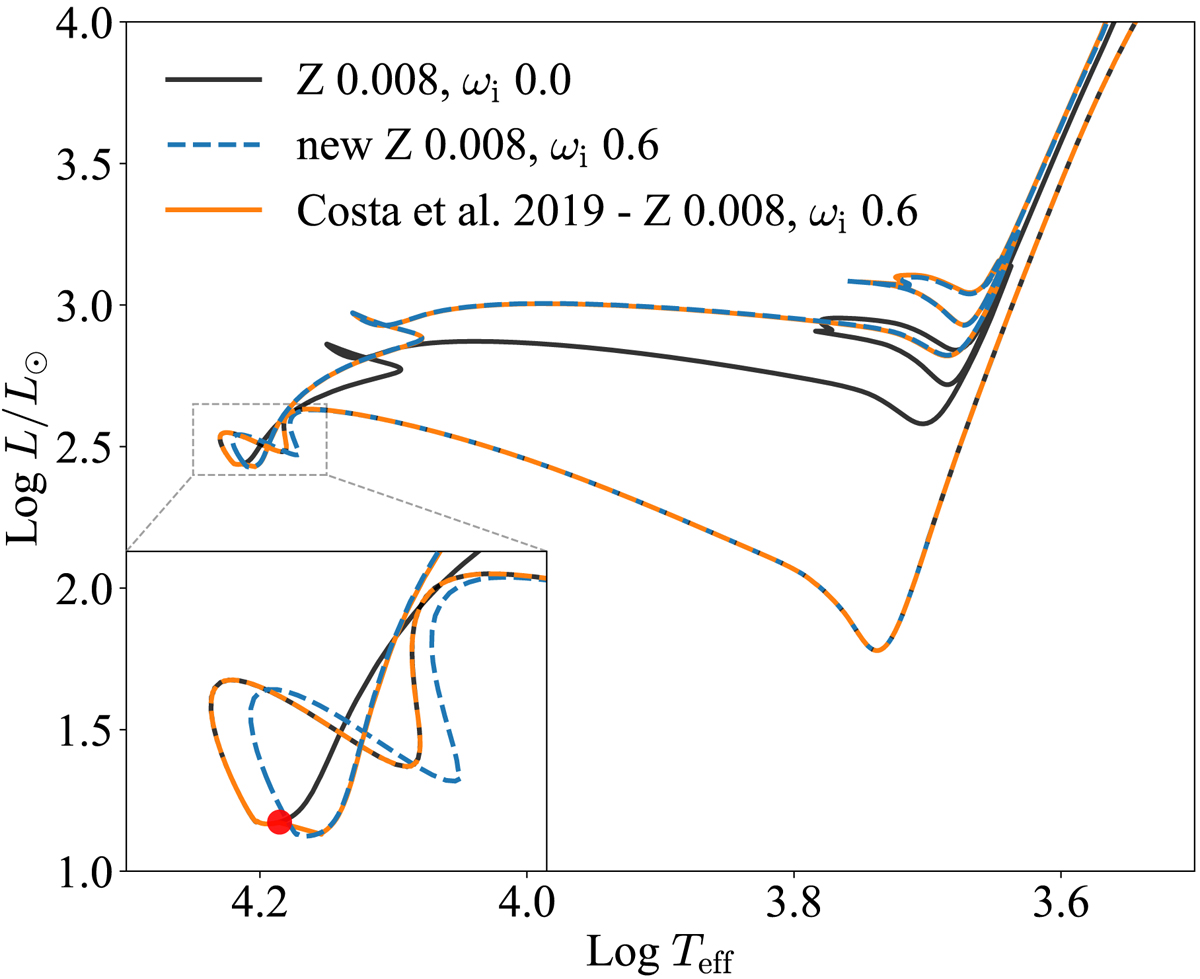
Comparison between tracks of a 4 M⊙ star. The black line is the non-rotating model, while the dashed blue and the solid orange lines are the new and old rotating tracks, respectively. A zoom of the ZAMS region is shown in the inset to emphasize the differences between the old and new methods of introduction of the angular velocity (see text).
Current usage metrics show cumulative count of Article Views (full-text article views including HTML views, PDF and ePub downloads, according to the available data) and Abstracts Views on Vision4Press platform.
Data correspond to usage on the plateform after 2015. The current usage metrics is available 48-96 hours after online publication and is updated daily on week days.
Initial download of the metrics may take a while.