Open Access
Fig. 8
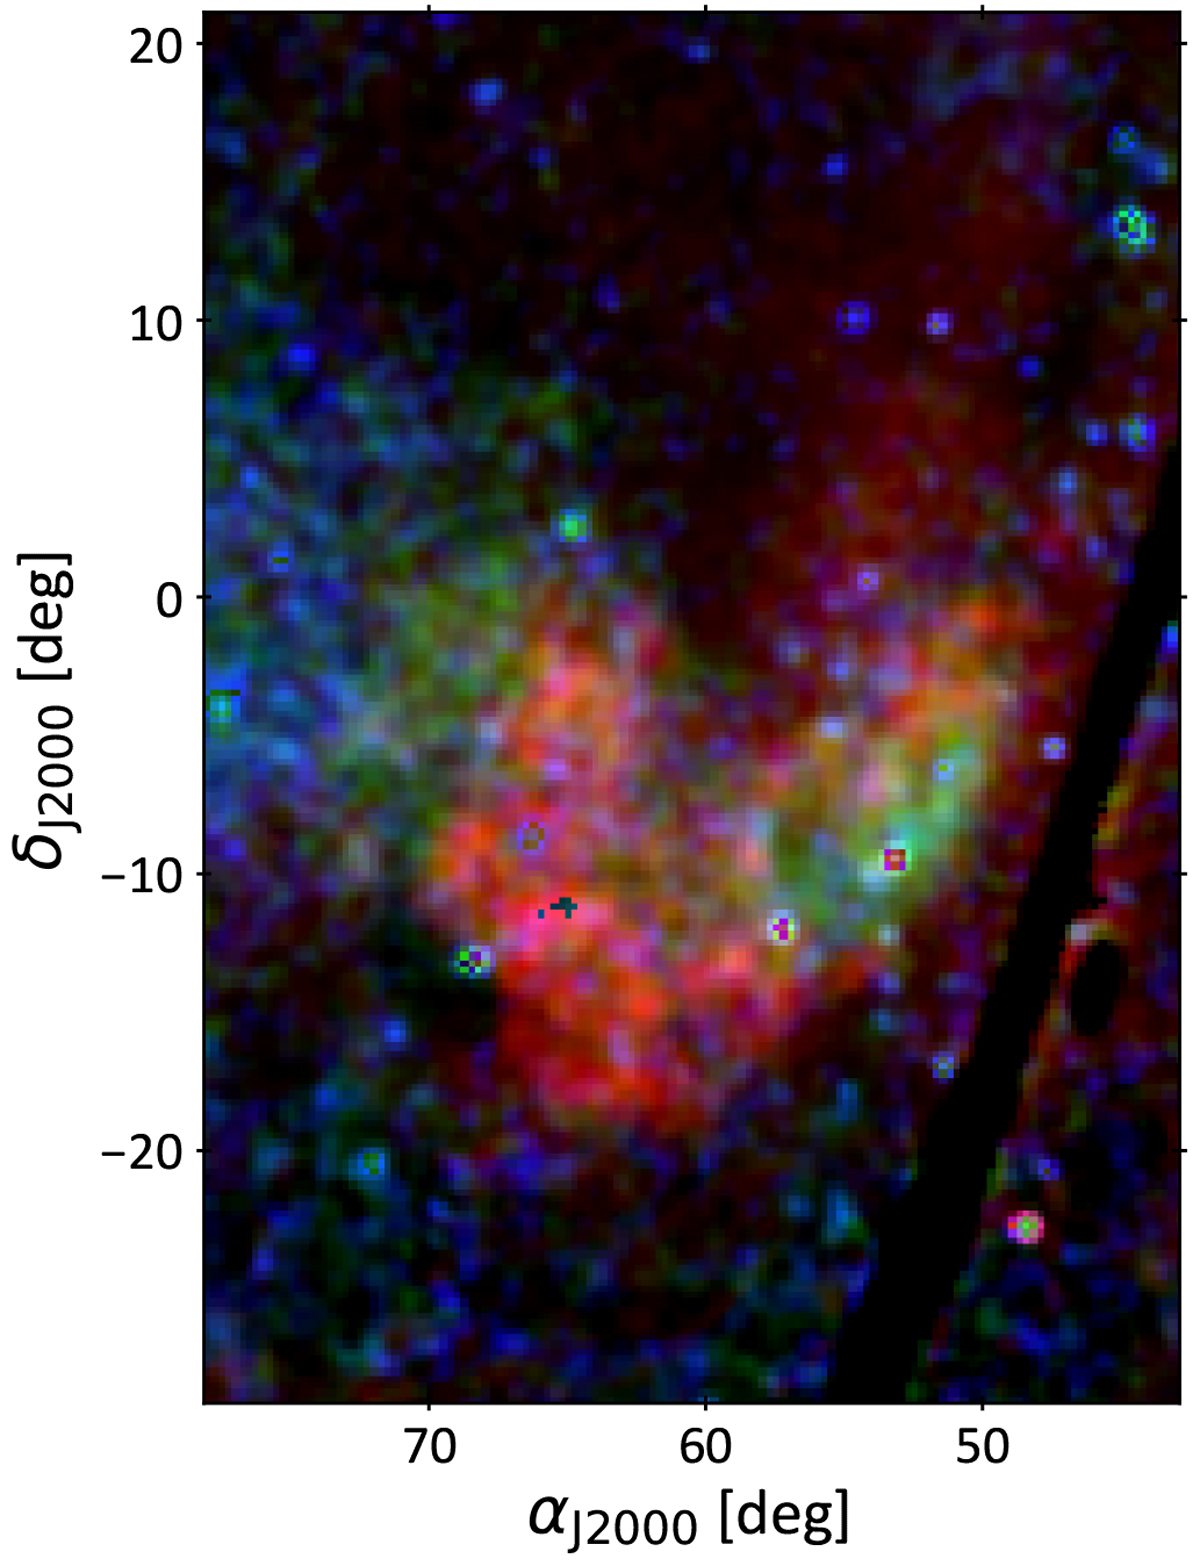
Composite image of the ROSAT intensities obtained at 0.25 keV (red), 0.75 keV (green), and 1.5 keV (blue) after subtraction of the Local Bubble foreground emission and of the halo background emission (according to Eq. (3)). The underexposed regions in the ROSAT survey are masked in black.
Current usage metrics show cumulative count of Article Views (full-text article views including HTML views, PDF and ePub downloads, according to the available data) and Abstracts Views on Vision4Press platform.
Data correspond to usage on the plateform after 2015. The current usage metrics is available 48-96 hours after online publication and is updated daily on week days.
Initial download of the metrics may take a while.