Fig. 7
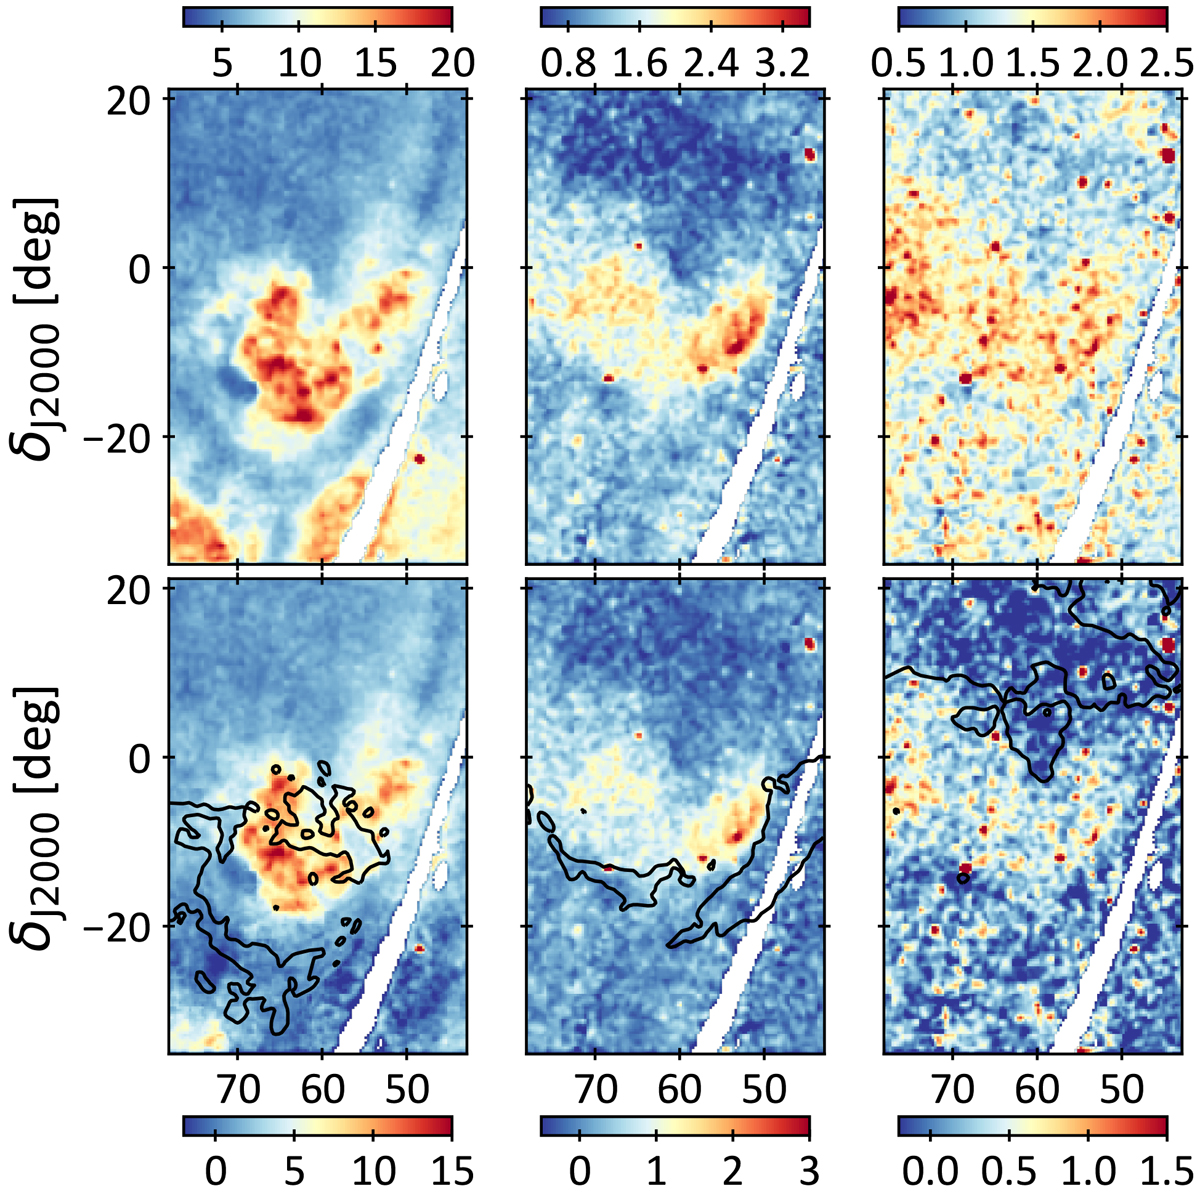
ROSAT intensity maps in units of 103 counts s−1 sr−1 in the 0.25 keV band (covering between 0.11 and 0.284 keV, left column), in the 0.75 keV band (covering between 0.44 and 1.21 keV, middle column), and in the 1.5 keV band (covering between 0.73 and 2.04 keV right column) from the all-sky survey in the top row, and the same maps corrected for the Local Bubble foreground emission and for a halo background emission in the bottom row (according to Eq. (3)). H I column density contours outline different cloud complexes: the north rim absorbs X-rays at all energies and is displayed in the 1.5 keV map (at NH I = 1.5 × 1021 cm−2). The west rim cloud bounds the X-ray emission at all energies and is displayed in the 0.75 keV map (at NH I = 2 × 1020 cm−2). The east shell cloud bounds the southern parts of the 0.75 and 1.5 keV emissions, but does not absorb the 0.25 keV emission. It is displayed in the 0.75 keV map (at NH I = 1.4 × 10²⁰). Additional absorption at 0.25 keV relates to the south loop (NH I = 2 × 1020 cm−2) and to MBM 20. The latter is not displayed, but is visible as the dark blue spot around α =68. °8 and δ = −14 . °2 in the top 0.25 keV map. For clarity, we smoothed he X-ray maps and H I contours with a Gaussian kernel of 0. °3 for display and maksed underexposed regions in the ROSAT survey in white.
Current usage metrics show cumulative count of Article Views (full-text article views including HTML views, PDF and ePub downloads, according to the available data) and Abstracts Views on Vision4Press platform.
Data correspond to usage on the plateform after 2015. The current usage metrics is available 48-96 hours after online publication and is updated daily on week days.
Initial download of the metrics may take a while.