Fig. 5
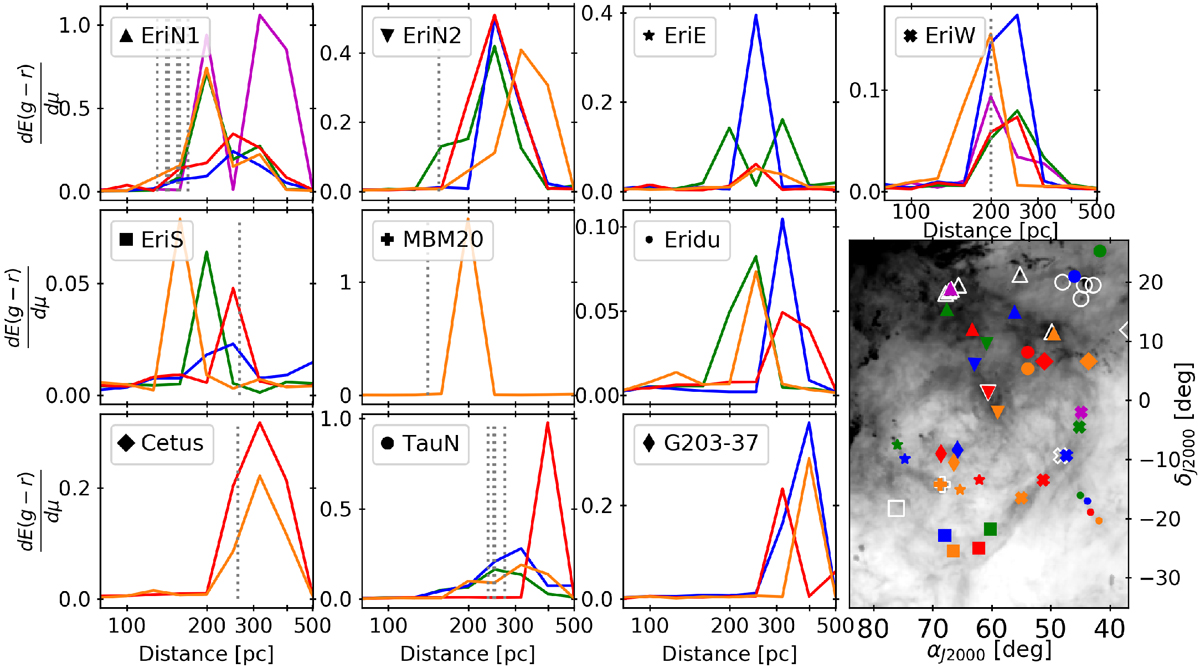
Mean reddening per distance unit profiles towards several directions for each H I cloud. The mean is computed for each direction over selected profiles in a circle with a radius of 1°. The map shows the pointed directions overlaid on the H I column density. The different markers correspond to the different cloud complexes, and the colours show the different directions for a given cloud. The cloud labels are north rim (EriN), west rim (EriW), east shell (EriE), south loop (EriS), and North Taurus (TauN). For clarity, we divided the north rim into its northern part (EriN1, upwards-pointing triangle), which marks the superbubble boundary, and its southern part (EriN2, downwards-pointing triangle), which overlaps the MBM 18 cloud. The white markers on the map show the MBM clouds. Their shape corresponds to the complex they are associated with. Their distances were derived by Zucker et al. (2019) and are reported in the plots with grey dotted lines.
Current usage metrics show cumulative count of Article Views (full-text article views including HTML views, PDF and ePub downloads, according to the available data) and Abstracts Views on Vision4Press platform.
Data correspond to usage on the plateform after 2015. The current usage metrics is available 48-96 hours after online publication and is updated daily on week days.
Initial download of the metrics may take a while.