Fig. 10
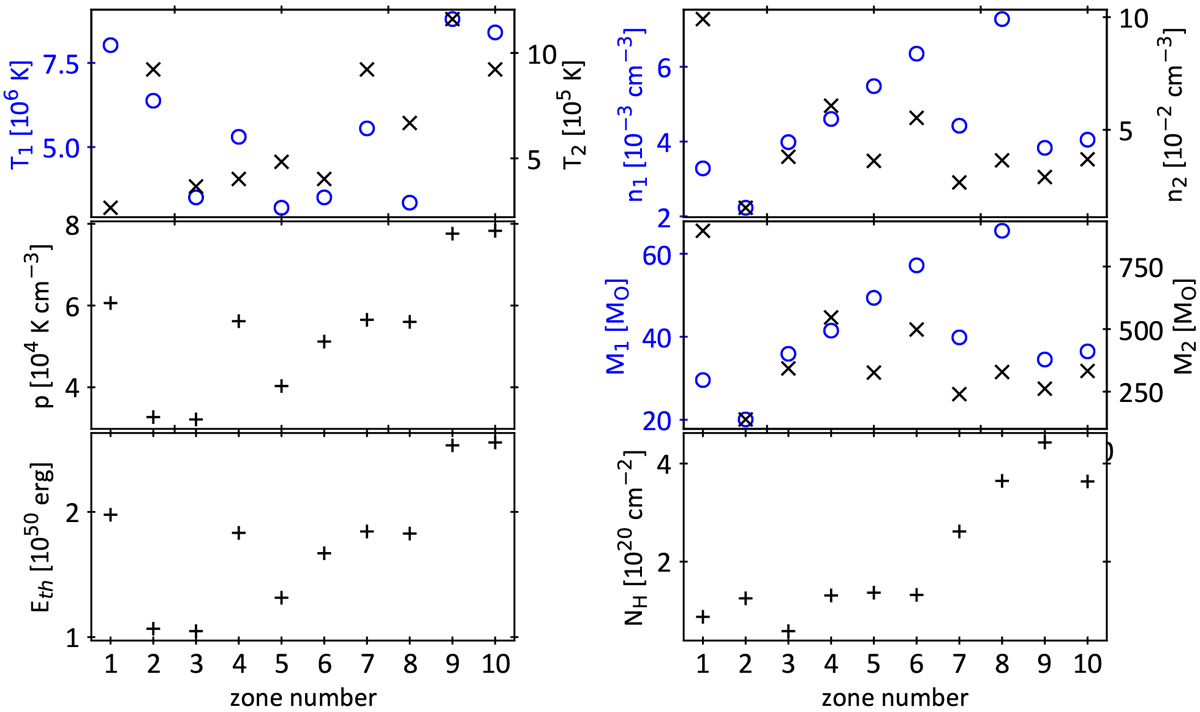
Temperatures, gas densities and masses, and common pressure obtained from the superposition of two hot plasma bubbles (mekal models, see Sect. 4.2), 80 pc in diameter, towards each of the areas sampled in Fig. 9. Blue circles (left scale) and black crosses (right scale) mark the hotter and colder media, respectively. The lower right plot gives the mean NH column density we used for absorption in each area.
Current usage metrics show cumulative count of Article Views (full-text article views including HTML views, PDF and ePub downloads, according to the available data) and Abstracts Views on Vision4Press platform.
Data correspond to usage on the plateform after 2015. The current usage metrics is available 48-96 hours after online publication and is updated daily on week days.
Initial download of the metrics may take a while.