Fig. 2.
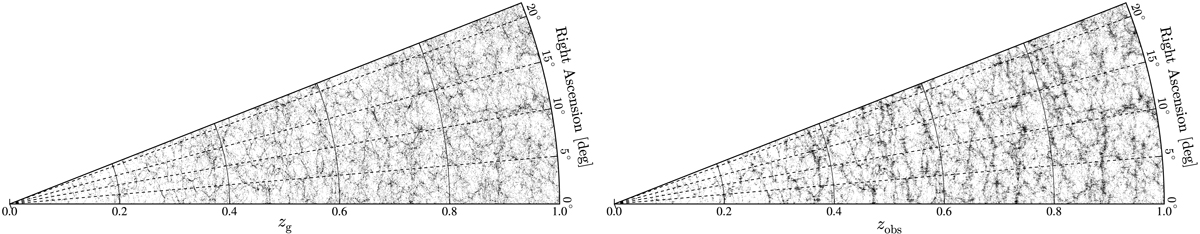
Left panel: spatial distribution of galaxies in a thin angular slice (1 deg) inside our mock lightcone. Each galaxy with Mstellar > 1010 M⊙ h−1 is shown as a black dot. The contribution of peculiar velocities is not included. Right panel: same, but including the peculiar velocities in the estimation of the redshift. The clustering is enhanced on large scales due to coherent bulk motions, whereas it is damped on small scales due to random motions inside dark matter haloes.
Current usage metrics show cumulative count of Article Views (full-text article views including HTML views, PDF and ePub downloads, according to the available data) and Abstracts Views on Vision4Press platform.
Data correspond to usage on the plateform after 2015. The current usage metrics is available 48-96 hours after online publication and is updated daily on week days.
Initial download of the metrics may take a while.