Fig. 8.
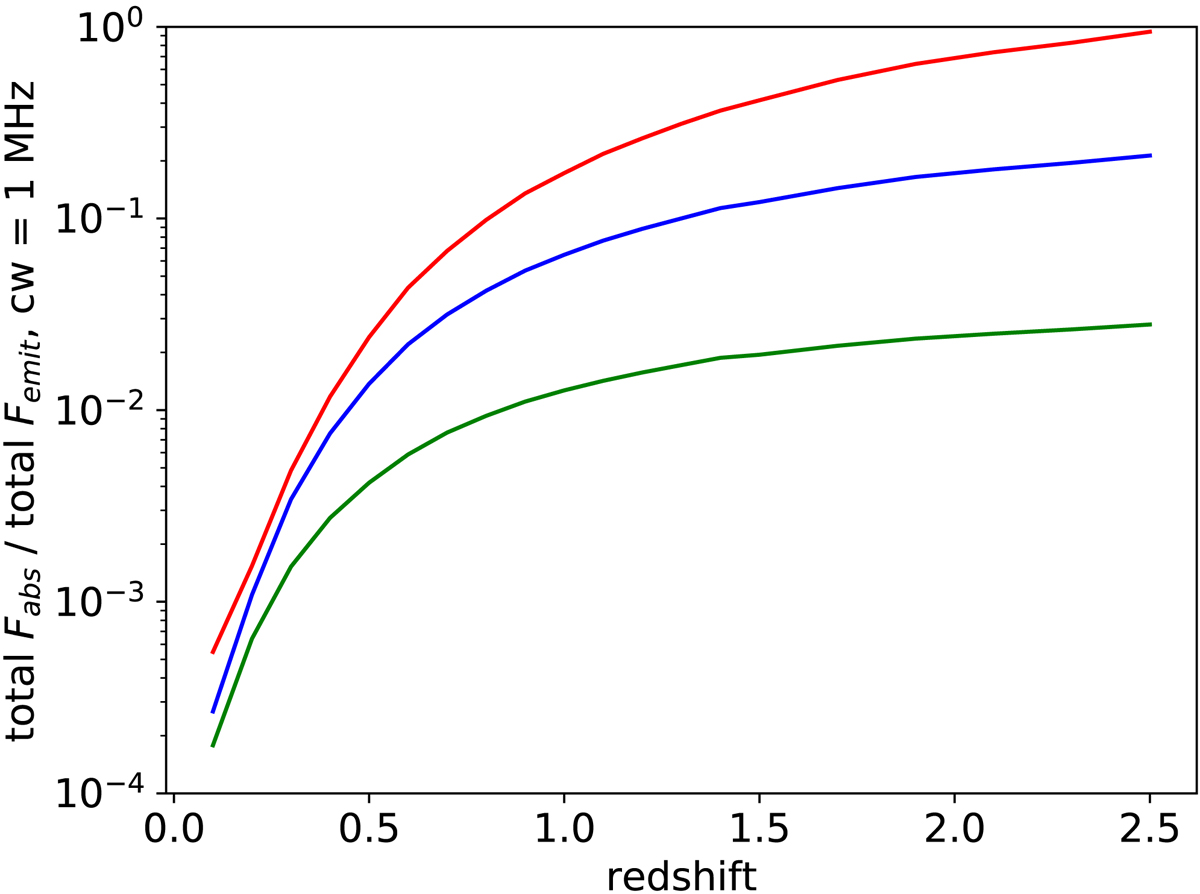
Ratio of the total absorbed to total emitted fluxes for all sources within voxels defined by channel width of 1 MHz placed at various redshifts using the O9 simulated sky, for varying sub-mJy radio continuum source number counts. The solid blue line is identical to the result presented in the right panel of Fig. 5. The solid red and green lines show the results for the extreme version of the number counts as represented by Owen & Morrison (2008) counts and Richards (2000) counts respectively, which are shown in Fig. 7.
Current usage metrics show cumulative count of Article Views (full-text article views including HTML views, PDF and ePub downloads, according to the available data) and Abstracts Views on Vision4Press platform.
Data correspond to usage on the plateform after 2015. The current usage metrics is available 48-96 hours after online publication and is updated daily on week days.
Initial download of the metrics may take a while.