Fig. 7.
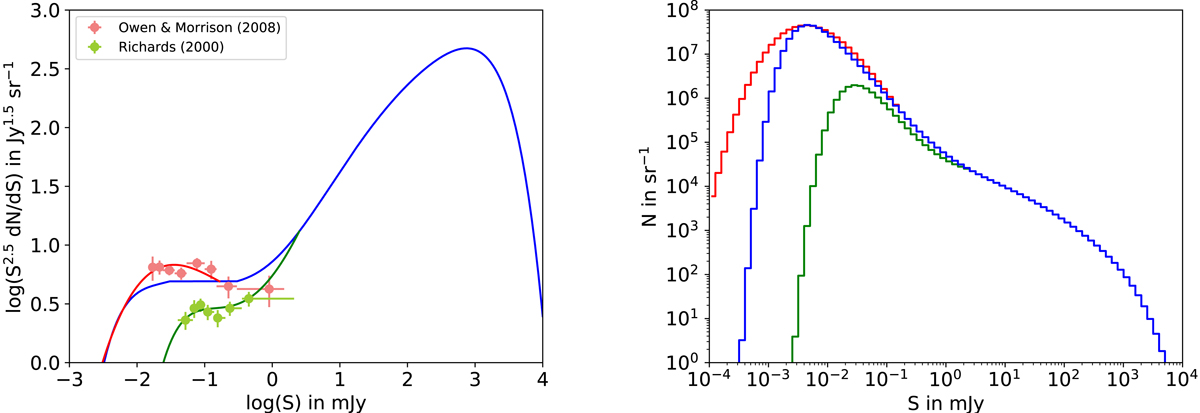
Varying number counts of radio continuum sources at 1.4 GHz for sub-mJy flux densities. Euclidean normalized differential (left panel) and total (right panel) as functions of flux density. The red and green points with error bars in the left panel are measurements from Owen & Morrison (2008) and Richards (2000) respectively. The blue curves in both panels is the fit from Hales et al. (2014a) that we use to calculate our results, whereas the red and green curves are our fit to the red and green points in the left panel. Our fits are extensions of the Hales et al. (2014a) fit at the low flux ranges where the red and green points deviate from the blue curve (see text for details). We note that in the right panel the x-axis starts an order of magnitude lower as compared to the left panel, in order to accentuate the variation in the number count at the low flux end from different measurements of the same.
Current usage metrics show cumulative count of Article Views (full-text article views including HTML views, PDF and ePub downloads, according to the available data) and Abstracts Views on Vision4Press platform.
Data correspond to usage on the plateform after 2015. The current usage metrics is available 48-96 hours after online publication and is updated daily on week days.
Initial download of the metrics may take a while.