Fig. 4.
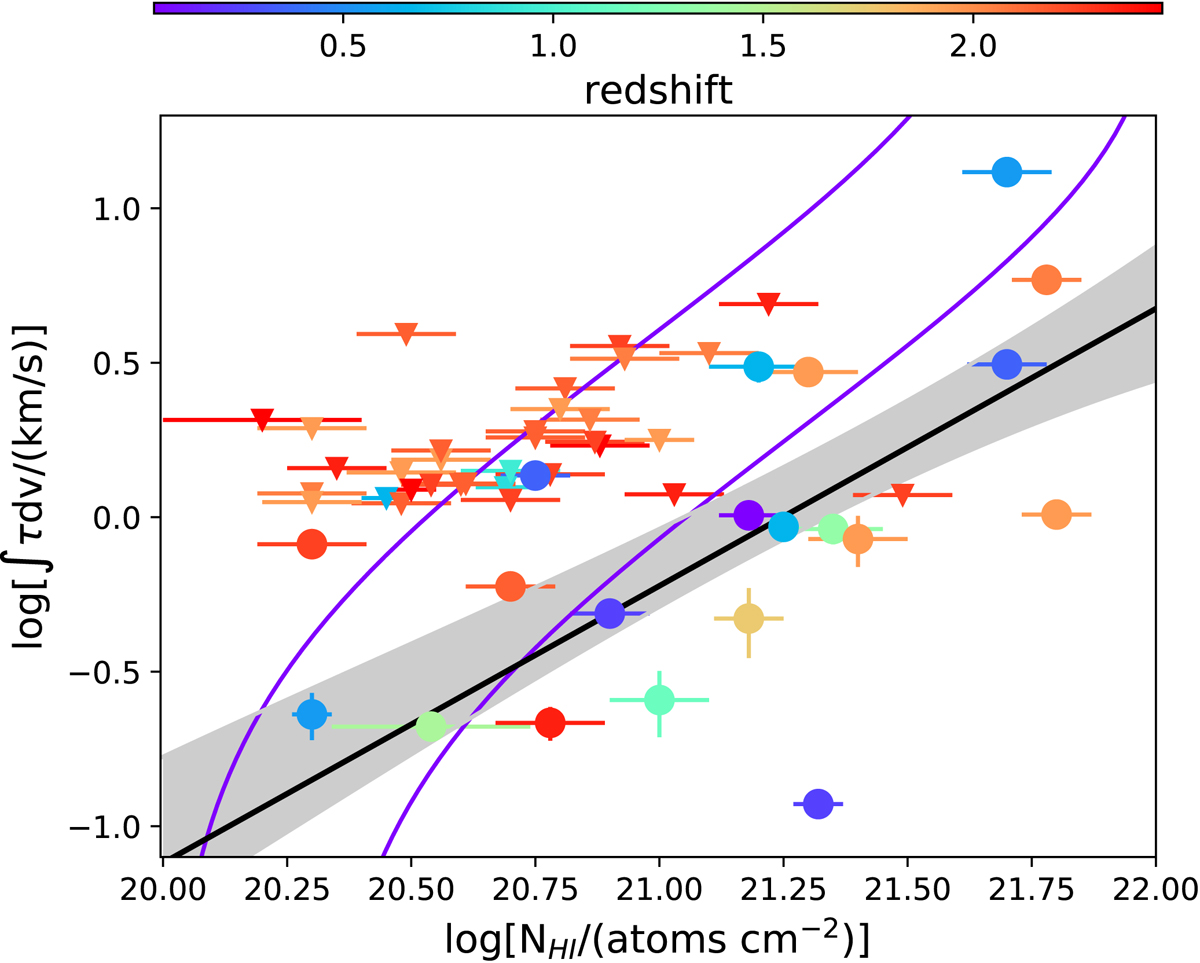
Variation of the measured integrated optical depth with the measured HI column density in DLAs and sub-DLAs up to a redshift of z = 2.5. The points are colour-coded according to their respective redshifts following the colourbar on top. Filled circles represent data with measured optical depths, whereas downward pointing triangles represent data with upper limits on optical depth. The black bold line represents the linear fit to the censored data, with the grey shaded region representing the uncertainty on the fit determined using bootstrapping datasets (see Sect. 2.5 for details). The violet lines encompass the region occupied by observations of various sightlines within the Galaxy (z = 0) with both HI absorption and emission measurements (Kanekar et al. 2011).
Current usage metrics show cumulative count of Article Views (full-text article views including HTML views, PDF and ePub downloads, according to the available data) and Abstracts Views on Vision4Press platform.
Data correspond to usage on the plateform after 2015. The current usage metrics is available 48-96 hours after online publication and is updated daily on week days.
Initial download of the metrics may take a while.