Fig. 1.
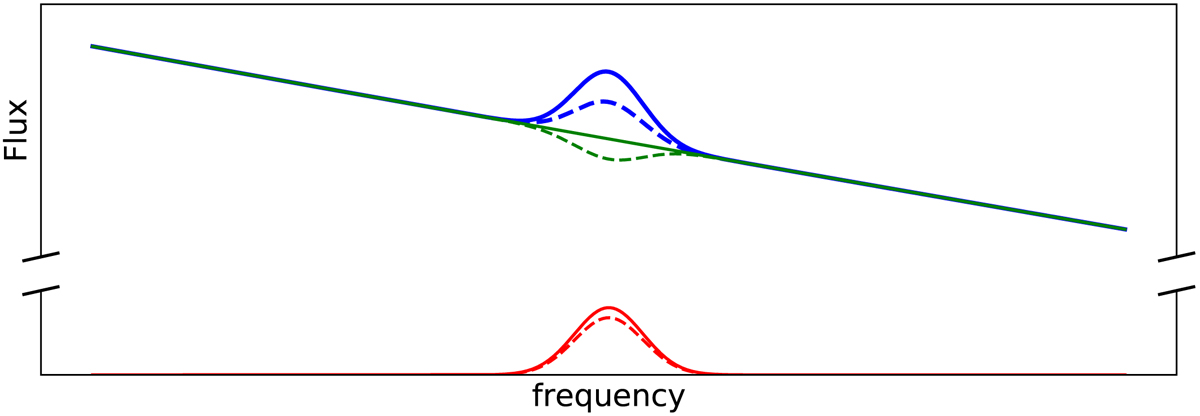
Schematic representation of how absorption will affect the signal that an HI IM experiment aims to detect. The total HI emission from sources within a given volume of the sky is represented by the bold red line, where the frequency spread corresponds to the redshift spread of the HI emitting sources within the volume. The dashed red line represents the HI emission after correcting for any potential absorption within the emitting sources themselves and within sources in the foreground. The bold green line represents the broadband spectrum of the radio continuum emission from sources in the foreground as well as the background of the HI emitting sources. We note that the flux level of this continuum emission is likely to be much higher than the HI emission one aims to detect. The dashed green line represents the radio continuum emission corrected for the absorption of a fraction of the emission incident from background radio continuum sources by the HI emitting sources themselves. The bold blue line represents the total of the HI emission and radio continuum emission (sum of the bold red and green lines), where the HI emission can be thought to be a positive fluctuation on top of a spectrally smooth broadband radio continuum “foreground”. The dashed blue line represents how the actual combined HI and radio continuum emission signal will look like, after correcting for the negative fluctuation due to the various absorptions (sum of the dashed red and green lines).
Current usage metrics show cumulative count of Article Views (full-text article views including HTML views, PDF and ePub downloads, according to the available data) and Abstracts Views on Vision4Press platform.
Data correspond to usage on the plateform after 2015. The current usage metrics is available 48-96 hours after online publication and is updated daily on week days.
Initial download of the metrics may take a while.