Fig. 16.
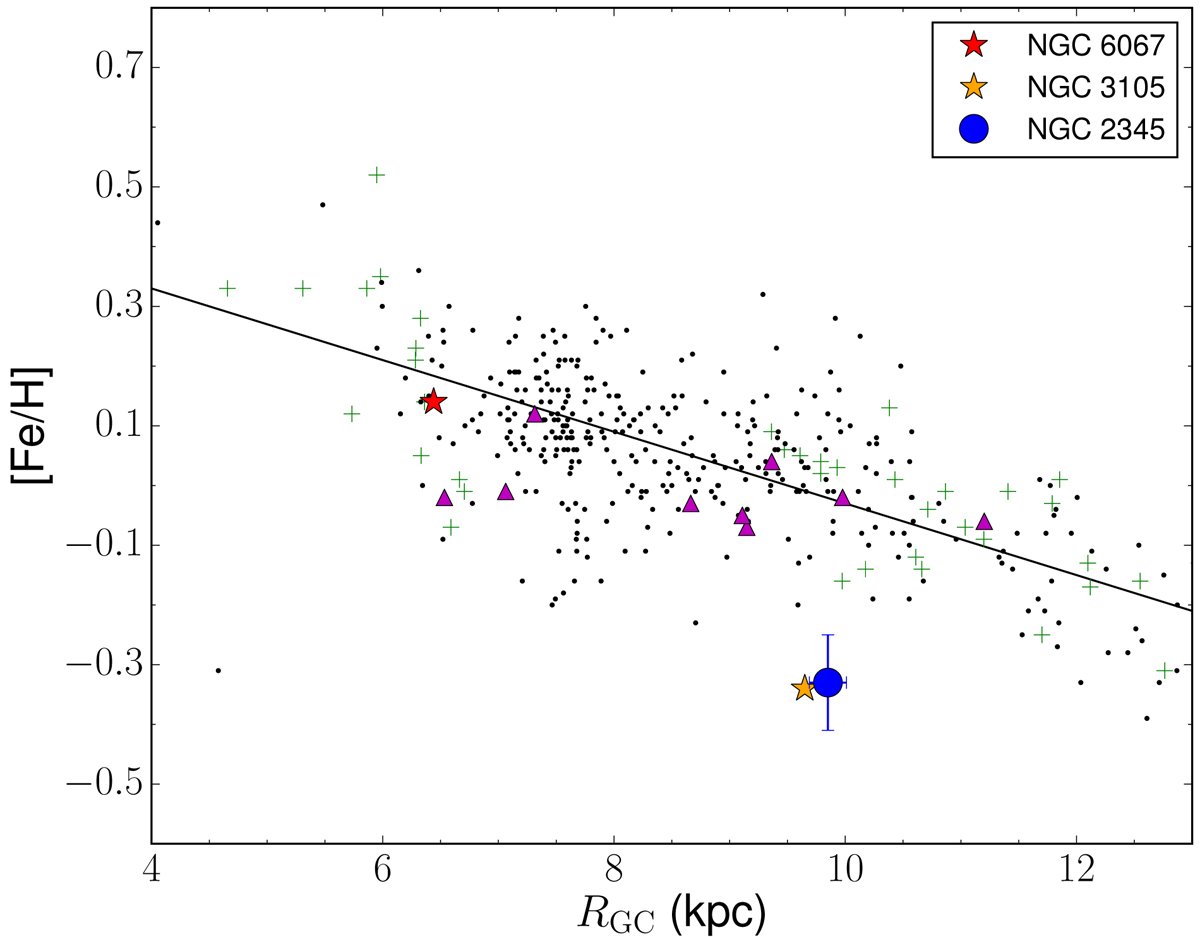
Iron abundance gradient in Milky Way found by Genovali et al. (2013, 2014). The black line is the Galactic gradient (−0.06 dex kpc−1), green crosses are Cepheids studied in those papers, whereas black dots show data for other Cepheids from literature used by these authors. Magenta triangles represent the young open clusters (< 500 Ma) in the sample compiled by Netopil et al. (2016). Finally, the blue circle is NGC 2345. NGC 6067 and NGC 3105, other young clusters analysed by our group with the same techniques, are plotted for comparison purposes. NGC 2345, together with NGC 3105, fall well below the metallicity typically observed at their. Galactocentric distance. All of the values shown in this plot are rescaled to Genovali et al. (2014), i.e. R⊙ = 7.95 kpc and A(Fe) = 7.50.
Current usage metrics show cumulative count of Article Views (full-text article views including HTML views, PDF and ePub downloads, according to the available data) and Abstracts Views on Vision4Press platform.
Data correspond to usage on the plateform after 2015. The current usage metrics is available 48-96 hours after online publication and is updated daily on week days.
Initial download of the metrics may take a while.