Fig. 13.
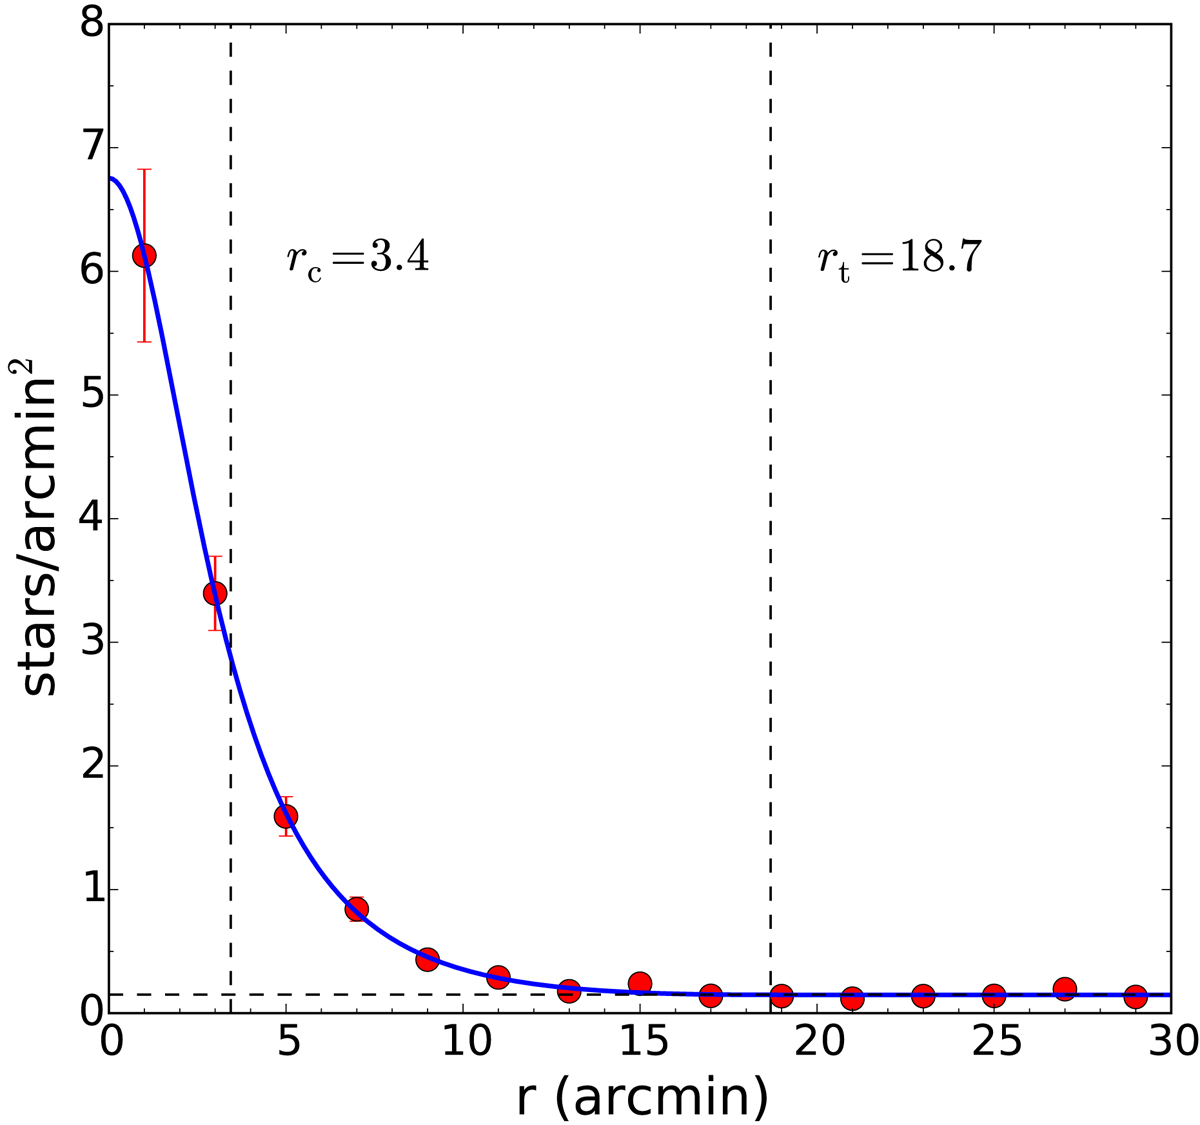
Projected density distribution of likely Gaia DR2 members in cluster field. The red circles are the observed values together with their Poisson errors. The blue line shows the fitted King profile from which we obtained both the core (rc) and the tidal (rt) radii. Their positions are indicated with vertical dashed lines. The background density (0.15 stars arcmin−2) is also represented as a horizontal dashed line.
Current usage metrics show cumulative count of Article Views (full-text article views including HTML views, PDF and ePub downloads, according to the available data) and Abstracts Views on Vision4Press platform.
Data correspond to usage on the plateform after 2015. The current usage metrics is available 48-96 hours after online publication and is updated daily on week days.
Initial download of the metrics may take a while.