Fig. 8
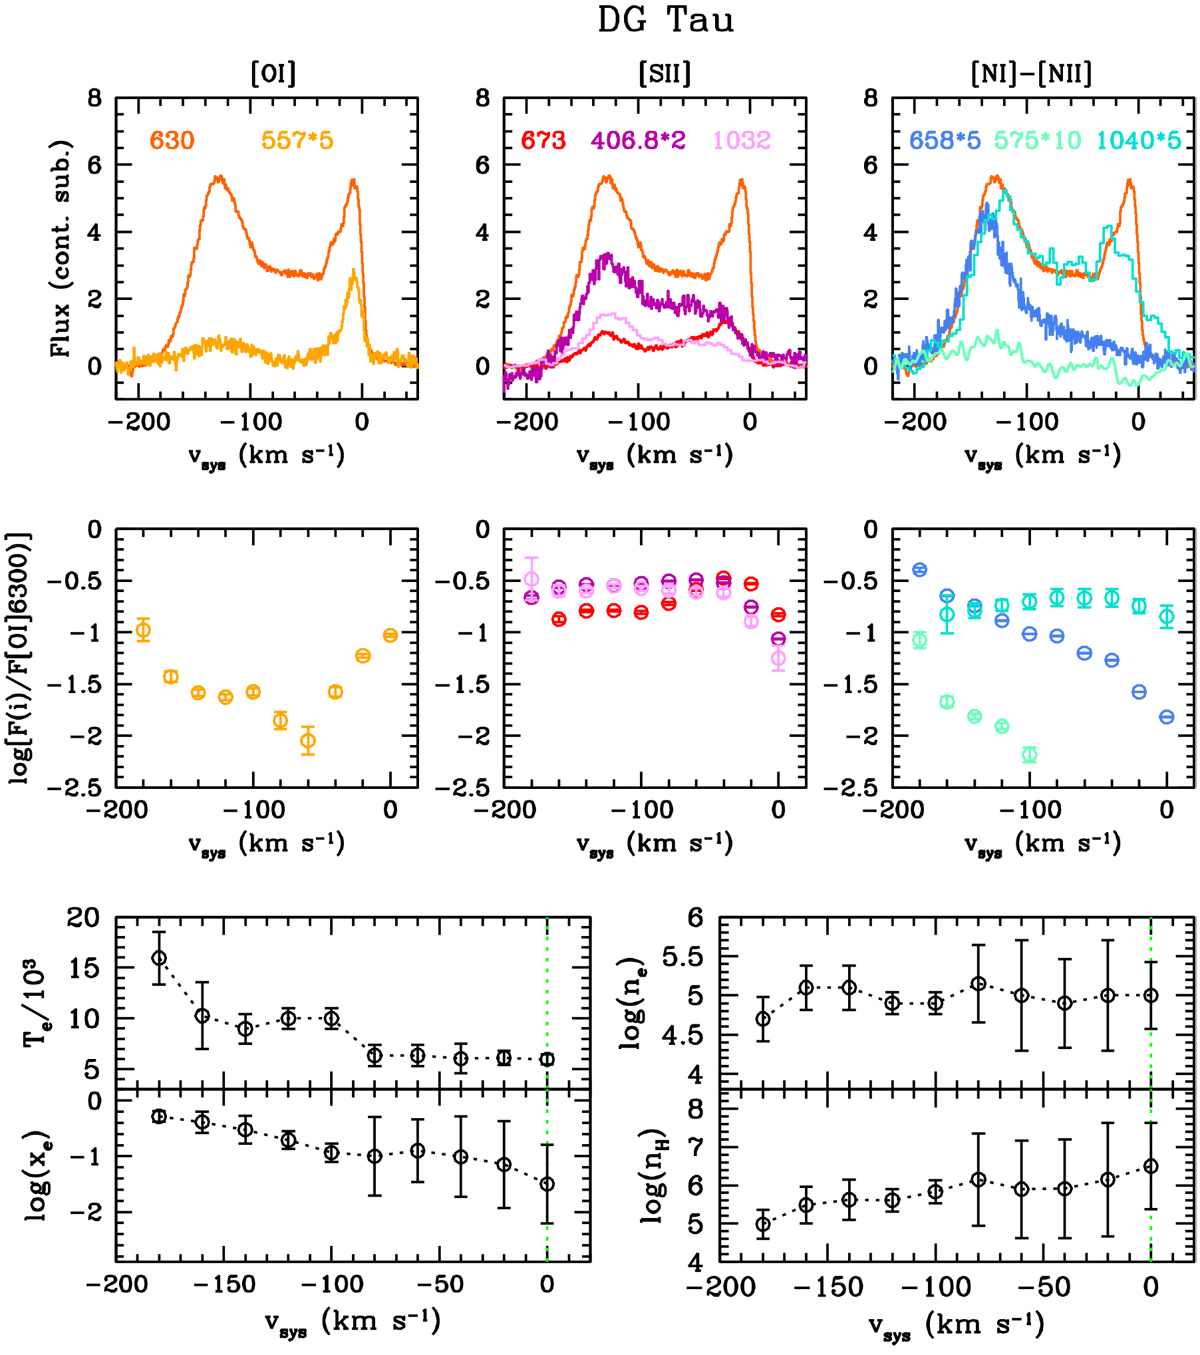
Upper panels: examples of the continuum-subtracted lines of DG Tau used in the fitting procedure. Different lines are depicted with different colors according to the labels. For a better visualization, some fluxes have been multiplied by a constant as indicated. The [O I]630 profile, which is taken as a reference in the fitting, is shown for comparison in each panel. Middle panels: de-reddened flux ratios with respect to [O I]630 computed in bins of 20 km s−1. Colors have the same meaning as in the top panels. Bottom panels: gas parameters (Te, ne, xe, nH) plotted as a function of the bins of velocity. The error bars correspond to models whose χ2 is up to 30% higher than that of the best fit. The green vertical dotted line marks the position of the rest velocity.
Current usage metrics show cumulative count of Article Views (full-text article views including HTML views, PDF and ePub downloads, according to the available data) and Abstracts Views on Vision4Press platform.
Data correspond to usage on the plateform after 2015. The current usage metrics is available 48-96 hours after online publication and is updated daily on week days.
Initial download of the metrics may take a while.