Fig. 7
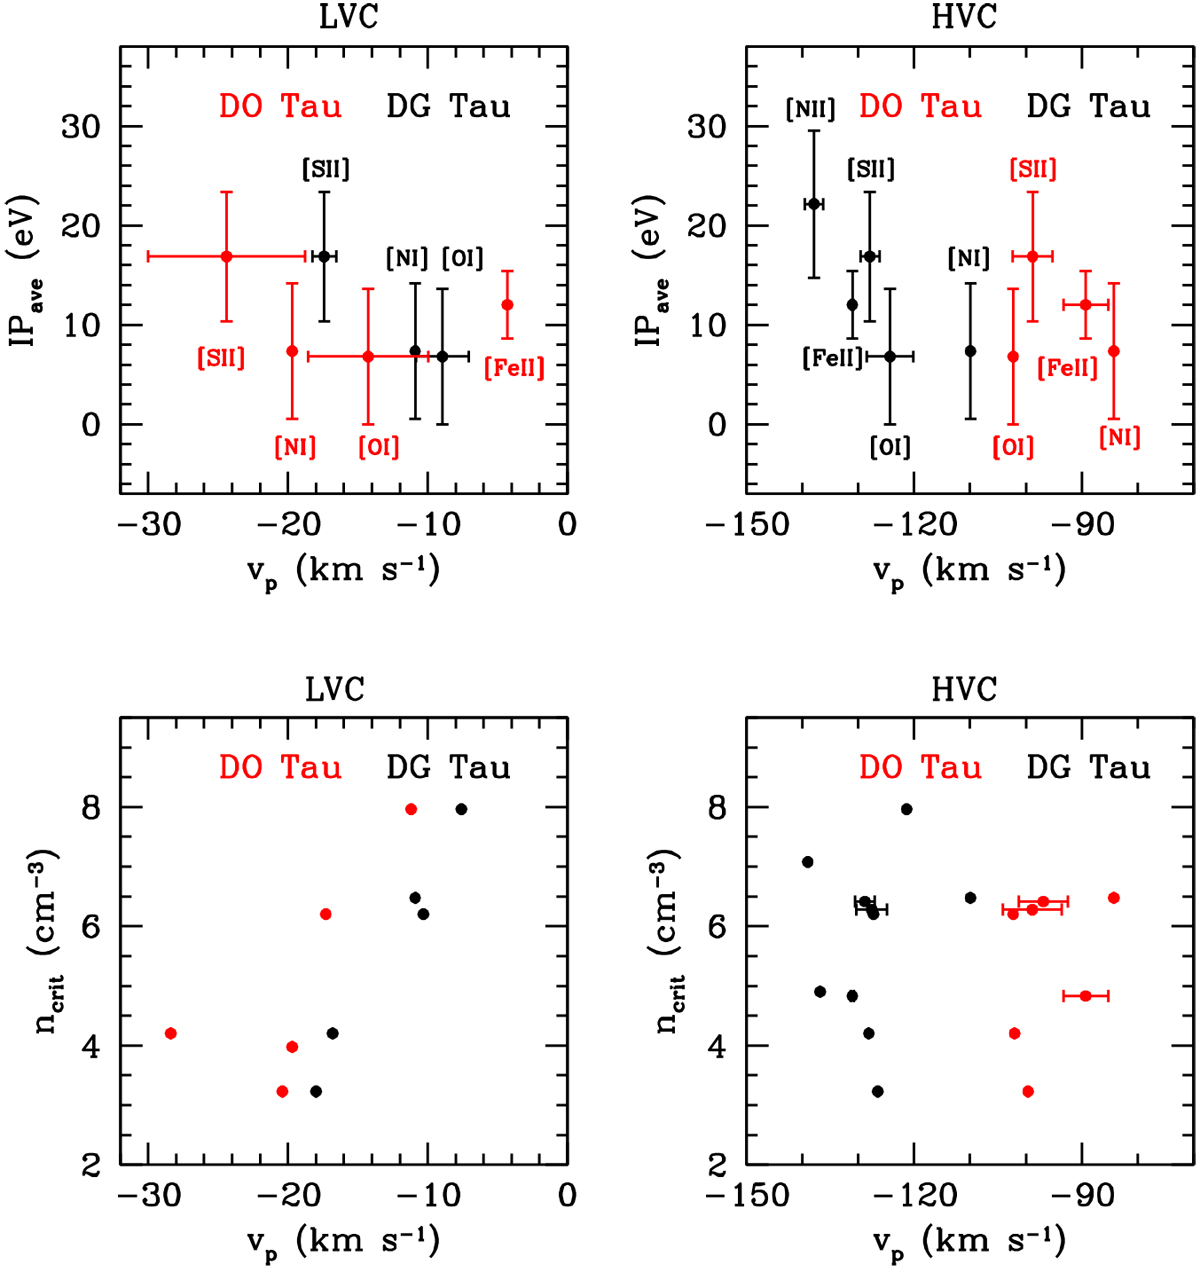
Upper panels: IPave vs. vp, where IPave = (IPi−1 +IPi)/2 and IPi is the ionization potential of the ionic stage i. The left and right panels refer to the LVC and the HVC, respectively. Data points of DO Tau and DG Tau are plotted with red and black dots, respectively. The error bars in the x-axis represent the dispersion between the vp values of lines of the same ionic species, while those in the y-axis are (IPi -IPi−1)/2. Lower panels: critical density (ncrit) of the upper level of the transition vs. vp. Symbols have the same meaning as in the upper panels.
Current usage metrics show cumulative count of Article Views (full-text article views including HTML views, PDF and ePub downloads, according to the available data) and Abstracts Views on Vision4Press platform.
Data correspond to usage on the plateform after 2015. The current usage metrics is available 48-96 hours after online publication and is updated daily on week days.
Initial download of the metrics may take a while.