Free Access
Fig. A.1
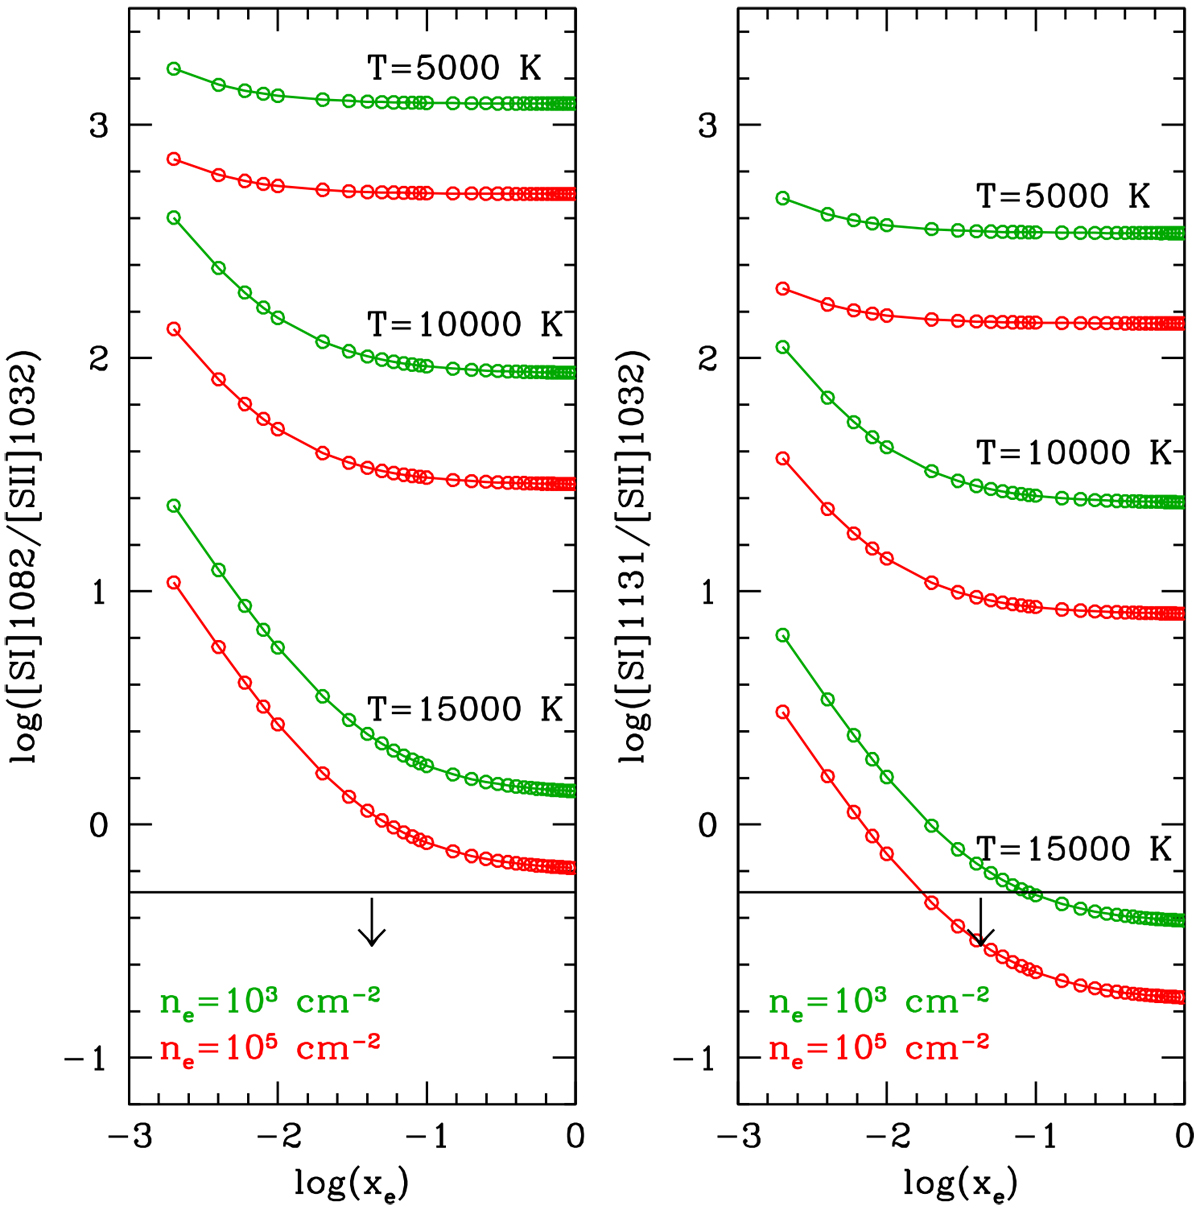
Theoretical [S I]/[S II] flux ratios vs. xe obtained assuming S = S I + S II + S III. Noticeably, both the [S I] lines are predicted to be brighter than the [S II]1032 line in the range of Te and ne that we fit (see Sect. 4). The horizontal line is the typical 3σ upper limit measured on our objects.
Current usage metrics show cumulative count of Article Views (full-text article views including HTML views, PDF and ePub downloads, according to the available data) and Abstracts Views on Vision4Press platform.
Data correspond to usage on the plateform after 2015. The current usage metrics is available 48-96 hours after online publication and is updated daily on week days.
Initial download of the metrics may take a while.