Fig. 9.
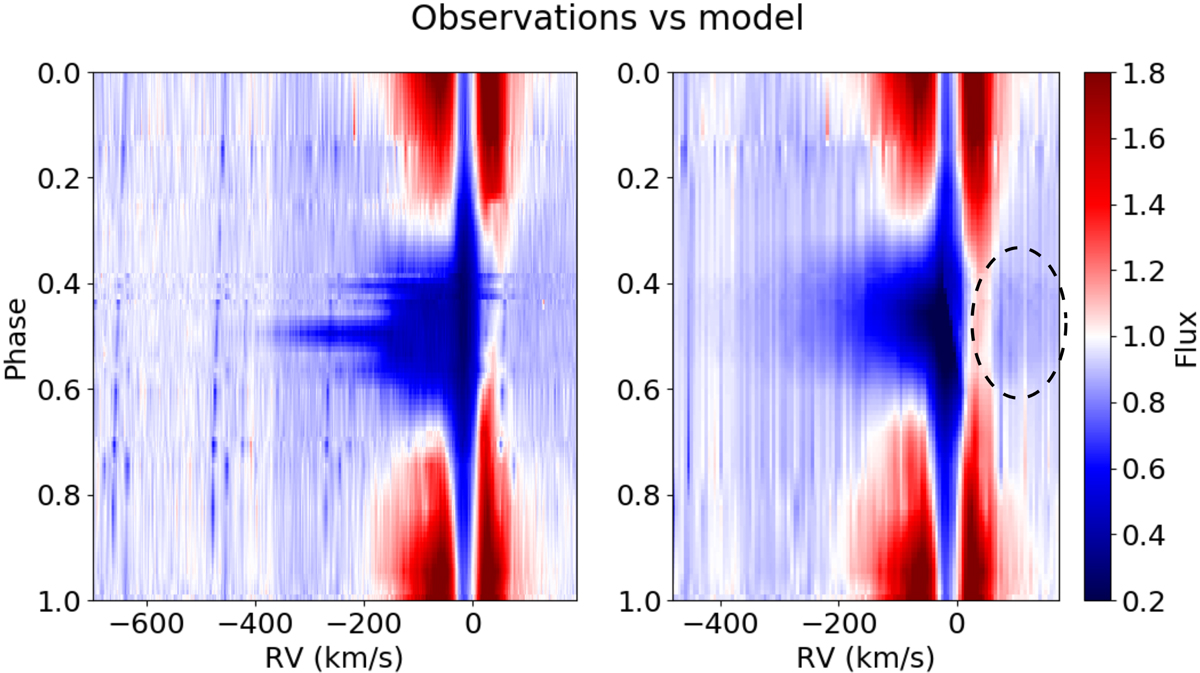
Dynamic spectra created from the observed spectra (left) and the model spectra (right). The model dynamic spectra where created using the best-fitting model with the stellar jet configuration. The encircled region in the model spectra highlights the extra red-shifted absorption feature that is created by the model, but which we do not observe, as explained in Sect. 5.1.
Current usage metrics show cumulative count of Article Views (full-text article views including HTML views, PDF and ePub downloads, according to the available data) and Abstracts Views on Vision4Press platform.
Data correspond to usage on the plateform after 2015. The current usage metrics is available 48-96 hours after online publication and is updated daily on week days.
Initial download of the metrics may take a while.