Fig. 9.
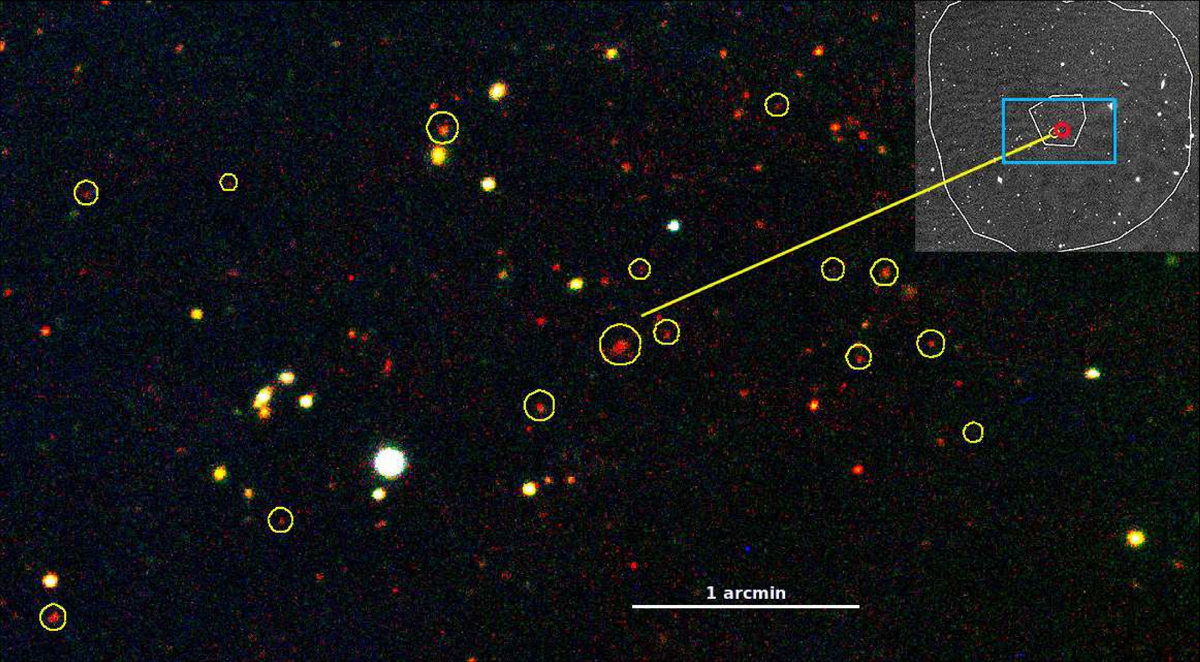
Zoomed RGB image of the central area of the high-z cluster (zspec = 0.816) associated with PSZ2 G126.57+51.61. We mark spectroscopically confirmed cluster members with yellow circles. The small top panel shows the WFC/INT i′-band image, in which white contours correspond to the 3 and 6 × 10⁻⁶ levels of the Compton y-map in this area. The red circle indicates the nominal PSZ2 position. The blue square shows the size of the area that is presented in the main RGB image.
Current usage metrics show cumulative count of Article Views (full-text article views including HTML views, PDF and ePub downloads, according to the available data) and Abstracts Views on Vision4Press platform.
Data correspond to usage on the plateform after 2015. The current usage metrics is available 48-96 hours after online publication and is updated daily on week days.
Initial download of the metrics may take a while.