Fig. 8.
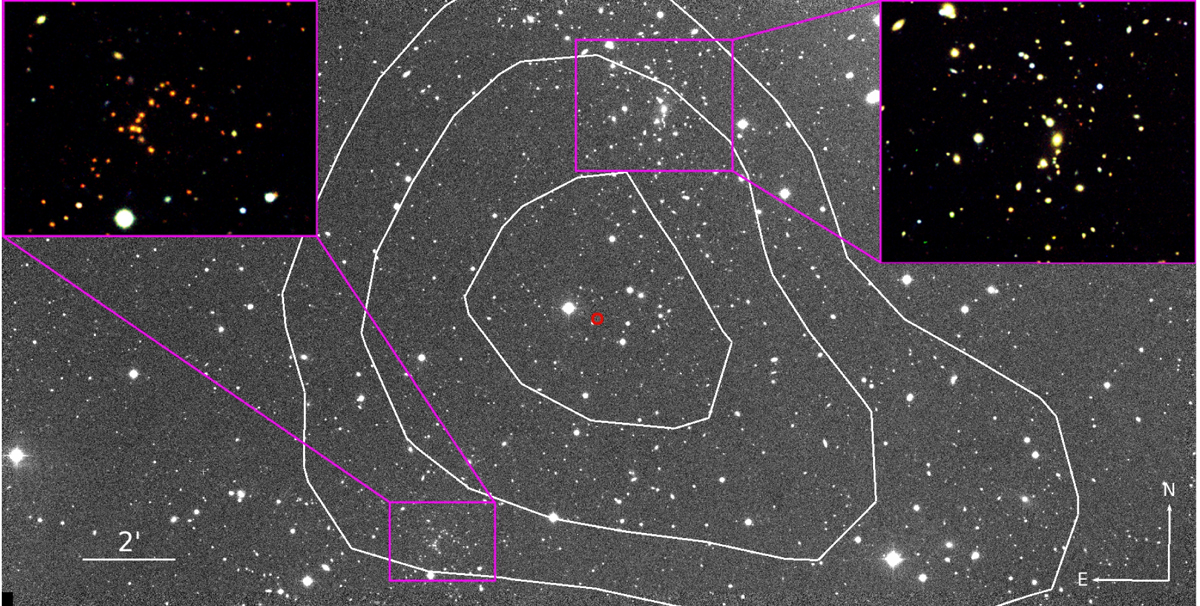
Compton y-map superimposed to the INT r′-band of the PSZ2 G076.55+60.29. White contours correspond to the 3, 4, and 5 × 10⁻⁶ levels of the Compton y-map in this area. The Planck nominal pointing is represented in red. In the upper corners we show zoomed RGB images of 327-A (left) and 327-B (right). At zspec = 0.632 and zspec = 0.287, the two systems are associated with this SZ signal. This is a clear example of a multiple detection.
Current usage metrics show cumulative count of Article Views (full-text article views including HTML views, PDF and ePub downloads, according to the available data) and Abstracts Views on Vision4Press platform.
Data correspond to usage on the plateform after 2015. The current usage metrics is available 48-96 hours after online publication and is updated daily on week days.
Initial download of the metrics may take a while.