Fig. 7.
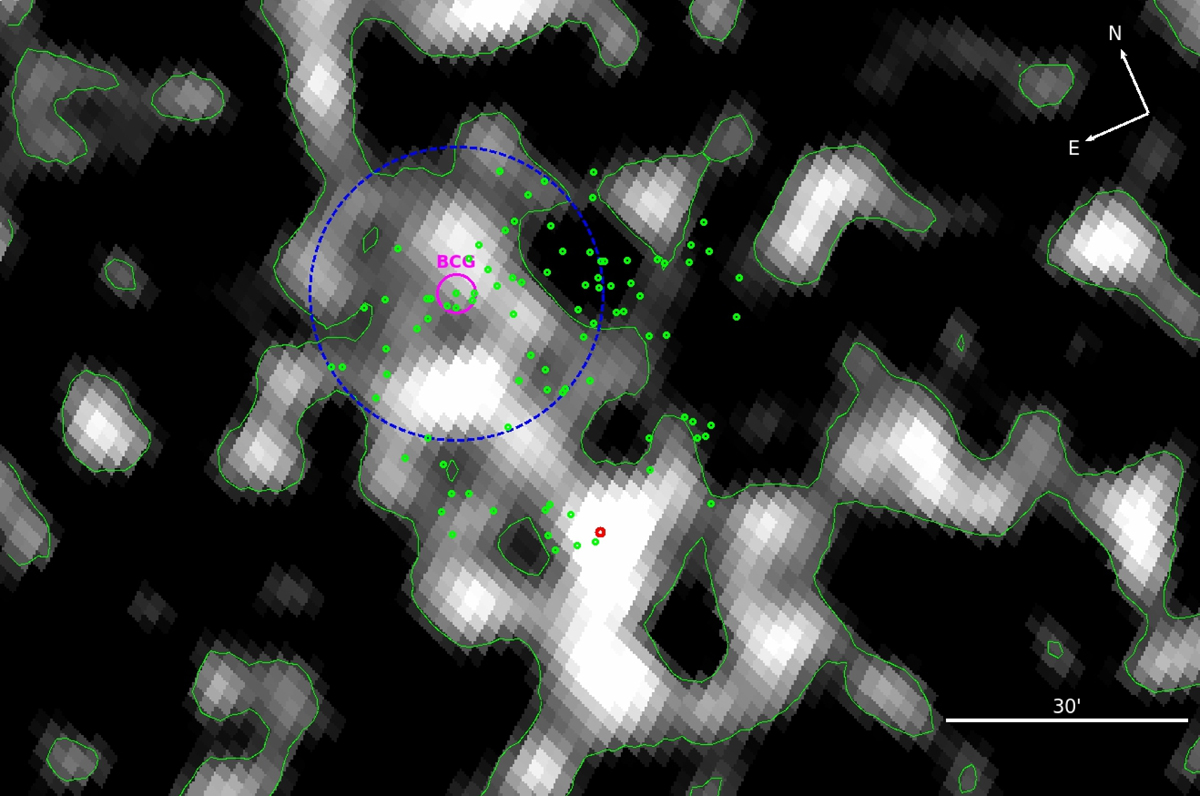
SZ emission as seen in the Compton y-maps for the source PSZ2 G328.96+71.97. The red dot represents the SZ coordinate as it appears in the PSZ2 catalog. The BCG of the cluster is plotted in magenta, and the remaining galaxies members are shown in green. The blue circle encloses the virial radius of this cluster. The 94 cluster members are placed completely off the SZ peak, and the optical counterpart of this SZ source remains unknown.
Current usage metrics show cumulative count of Article Views (full-text article views including HTML views, PDF and ePub downloads, according to the available data) and Abstracts Views on Vision4Press platform.
Data correspond to usage on the plateform after 2015. The current usage metrics is available 48-96 hours after online publication and is updated daily on week days.
Initial download of the metrics may take a while.