Fig. 6.
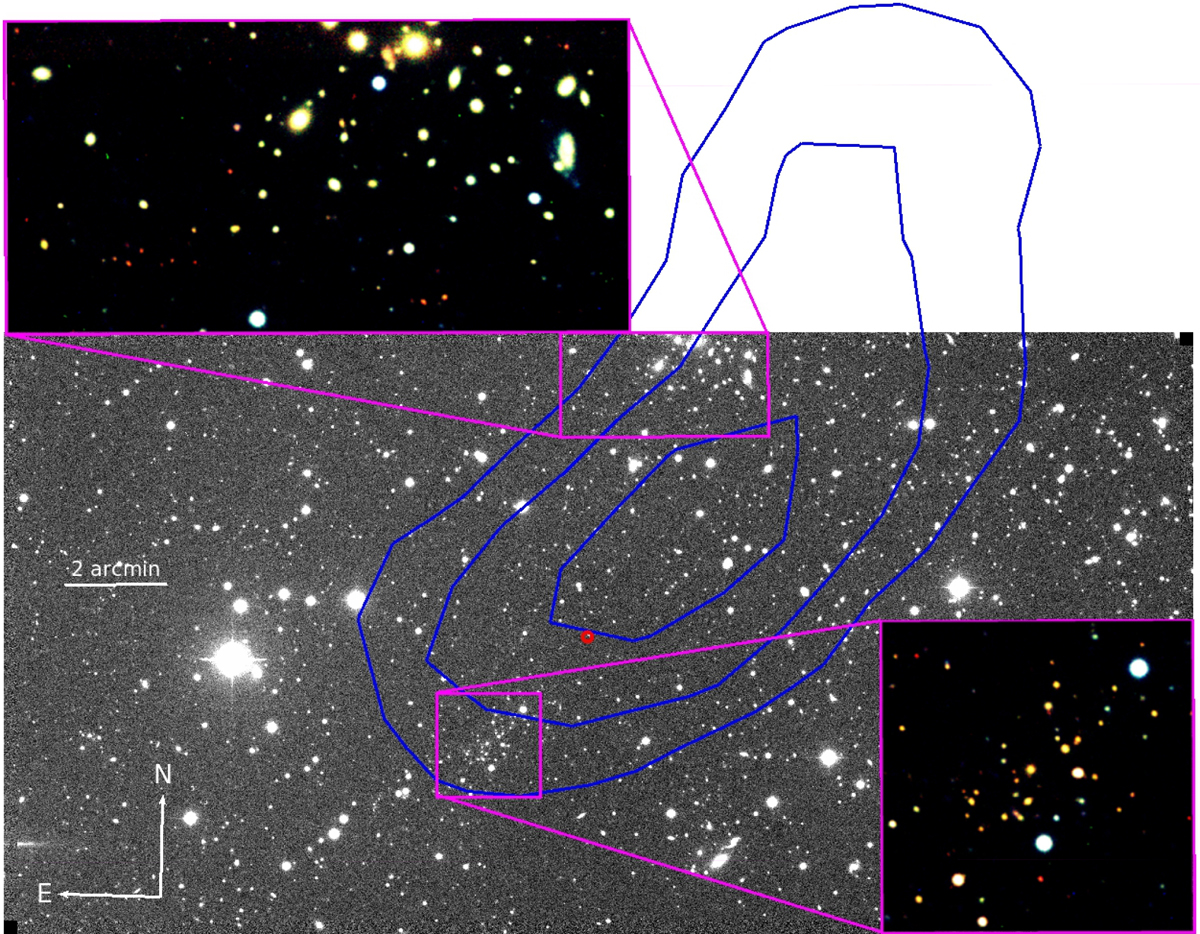
Compton y-map superimposed on the INT r′ band of PSZ2 G130.64+37.16. Blue contours correspond to the 4, 4.6, and 5.2 × 10⁻⁶ levels of the Compton y-map in this area. The nominal SZ pointing (red) is clearly closer to cluster 644-A (zoomed-in in the lower right region), which has 14 spectroscopic members and shows a velocity dispersion close to 1000 km s−1; cluster 644-B (zoomed-in in the upper left region) is ![]() away from the SZ center, but the MILCA y-map shows that the contours are elongated along this counterpart location, which is twice as rich as that of 644-A. The position error in the Planck catalog here is
away from the SZ center, but the MILCA y-map shows that the contours are elongated along this counterpart location, which is twice as rich as that of 644-A. The position error in the Planck catalog here is ![]() , which is more than twice the mean position error.
, which is more than twice the mean position error.
Current usage metrics show cumulative count of Article Views (full-text article views including HTML views, PDF and ePub downloads, according to the available data) and Abstracts Views on Vision4Press platform.
Data correspond to usage on the plateform after 2015. The current usage metrics is available 48-96 hours after online publication and is updated daily on week days.
Initial download of the metrics may take a while.