Fig. 3.
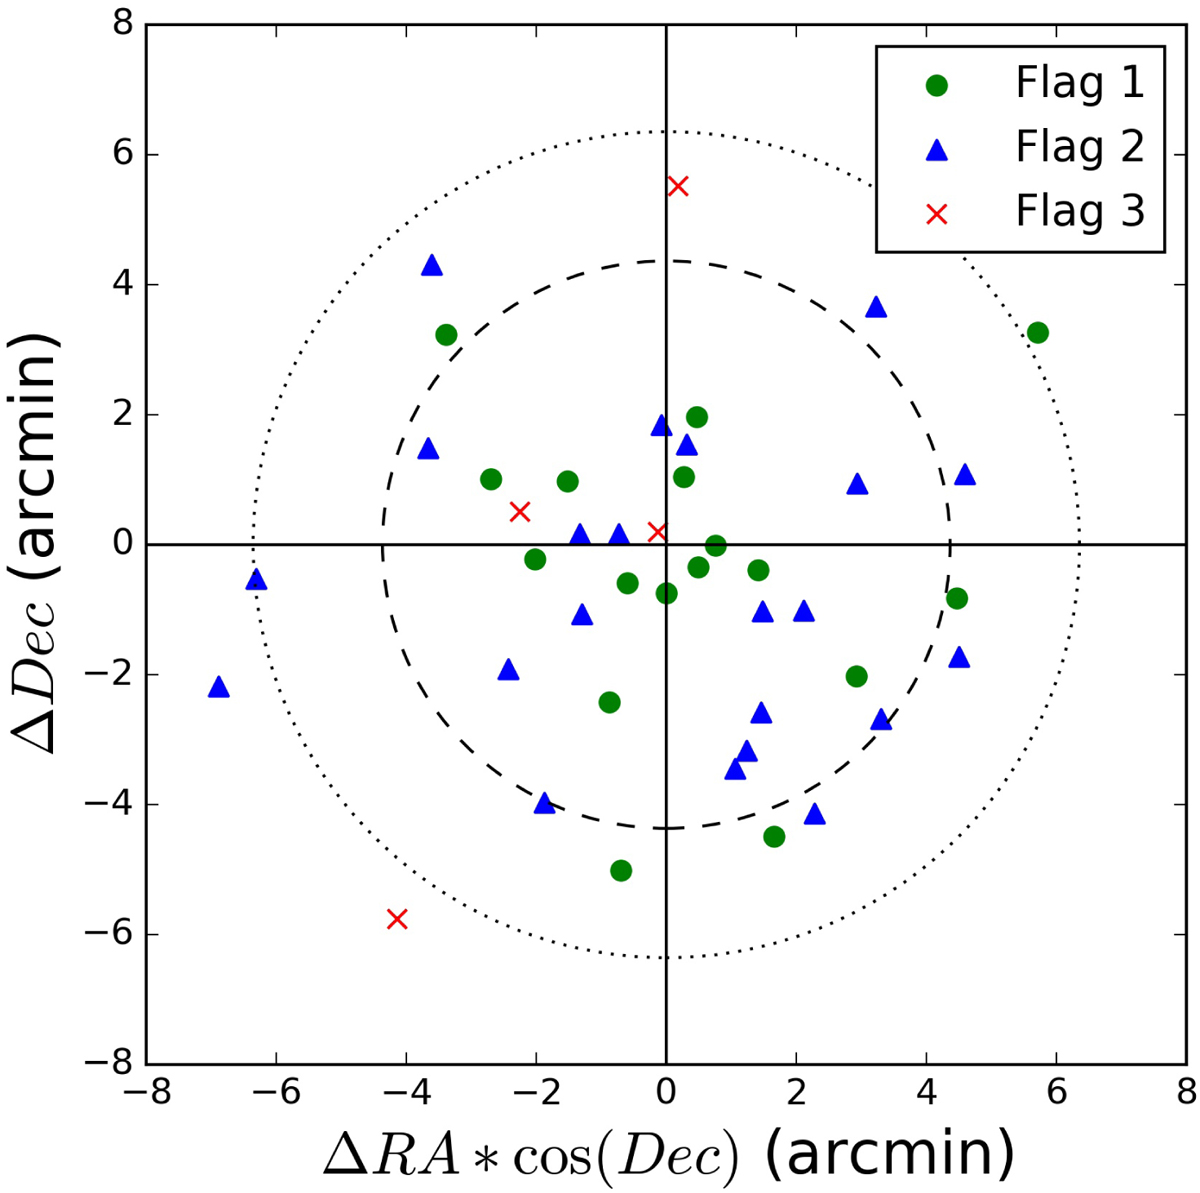
Spatial distribution of the optical counterpart centers with respect to the nominal center in the Planck PSZ2 catalog. Green dots, blue triangles, and red crosses correspond to clusters classified with Flag 1, Flag 2, and Flag 3, respectively. Dashed and dotted lines show the regions enclosing 68 % and 95 % of the confirmed clusters, flagged 1 and 2, respectively
Current usage metrics show cumulative count of Article Views (full-text article views including HTML views, PDF and ePub downloads, according to the available data) and Abstracts Views on Vision4Press platform.
Data correspond to usage on the plateform after 2015. The current usage metrics is available 48-96 hours after online publication and is updated daily on week days.
Initial download of the metrics may take a while.