Fig. 2.
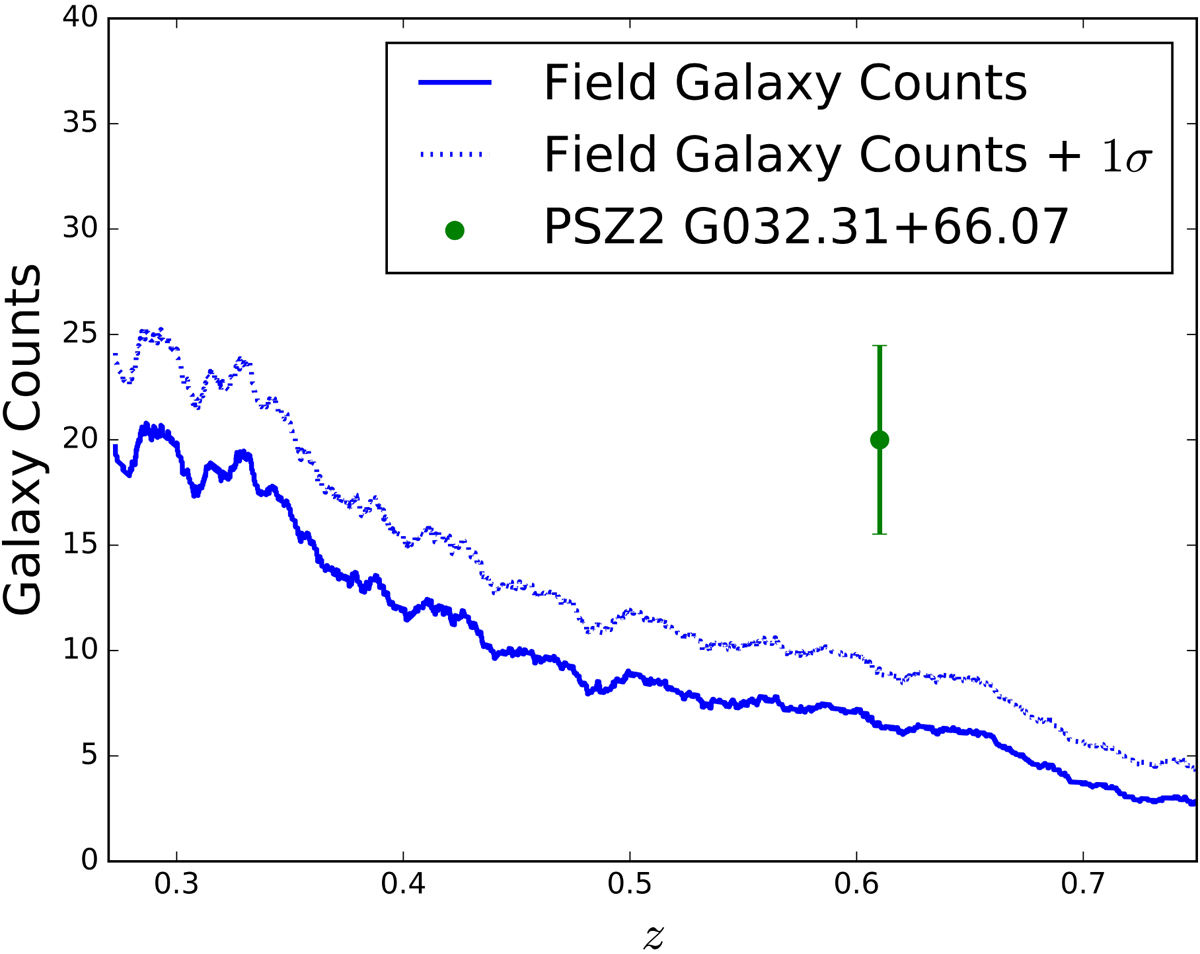
Galaxy counts as a function of redshift in the field of the spectroscopically confirmed cluster PSZ2 G032.31+66.07. The galaxy counts for this particular cluster and its 1σ error bars are shown in green. The blue line represents the galaxy counts outside the 1 Mpc region from the optical center of the cluster, and the dashed blue line represents 1σ uncertainty above the latter.
Current usage metrics show cumulative count of Article Views (full-text article views including HTML views, PDF and ePub downloads, according to the available data) and Abstracts Views on Vision4Press platform.
Data correspond to usage on the plateform after 2015. The current usage metrics is available 48-96 hours after online publication and is updated daily on week days.
Initial download of the metrics may take a while.