Free Access
Fig. 14.
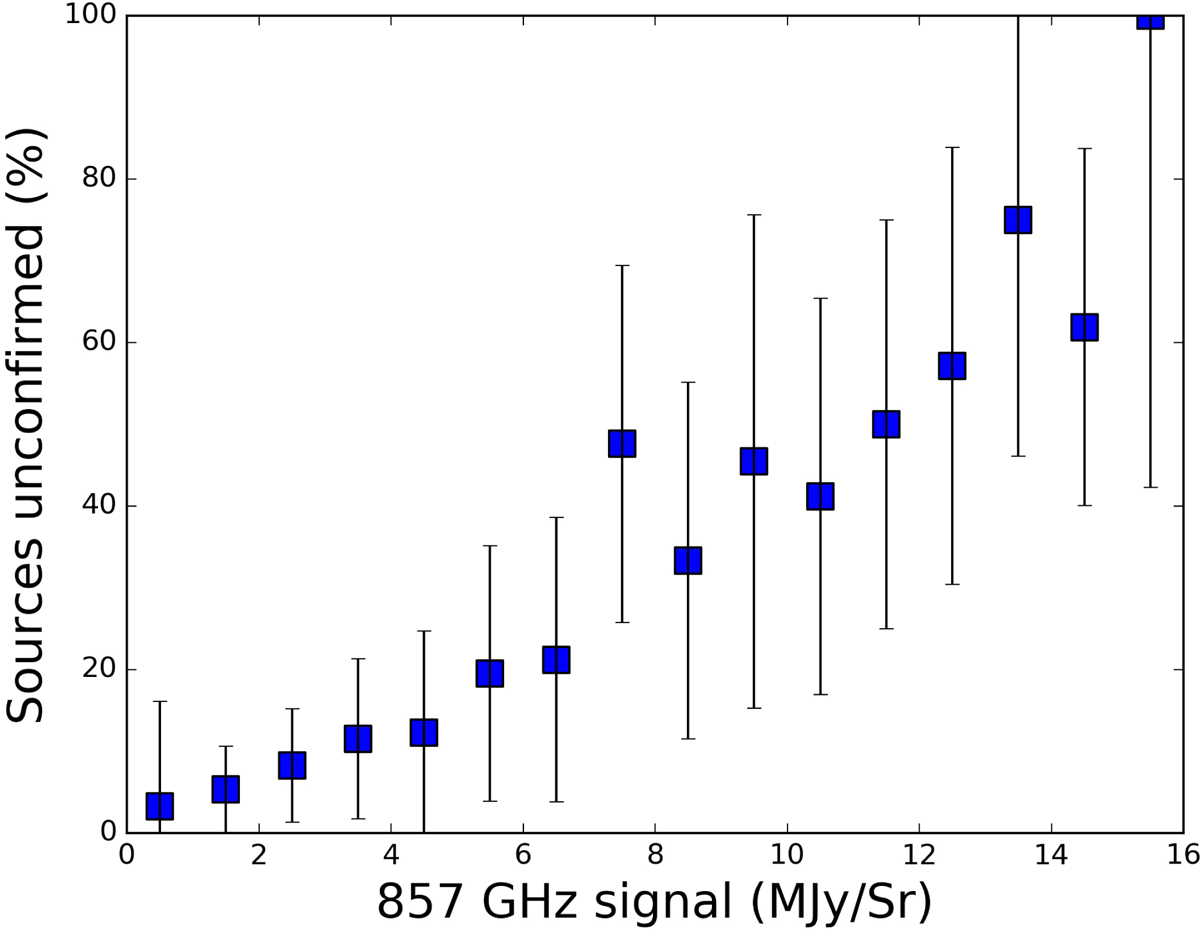
Ratio between unconfirmed and total number of sources for the PSZ2-North sample (Dec > −15°) as a function of the 857 GHz signal in bins of 1 MJy sr−1. Error bars correspond to a Poisson error in the distribution of the total number of sources.
Current usage metrics show cumulative count of Article Views (full-text article views including HTML views, PDF and ePub downloads, according to the available data) and Abstracts Views on Vision4Press platform.
Data correspond to usage on the plateform after 2015. The current usage metrics is available 48-96 hours after online publication and is updated daily on week days.
Initial download of the metrics may take a while.