Free Access
Fig. 12.
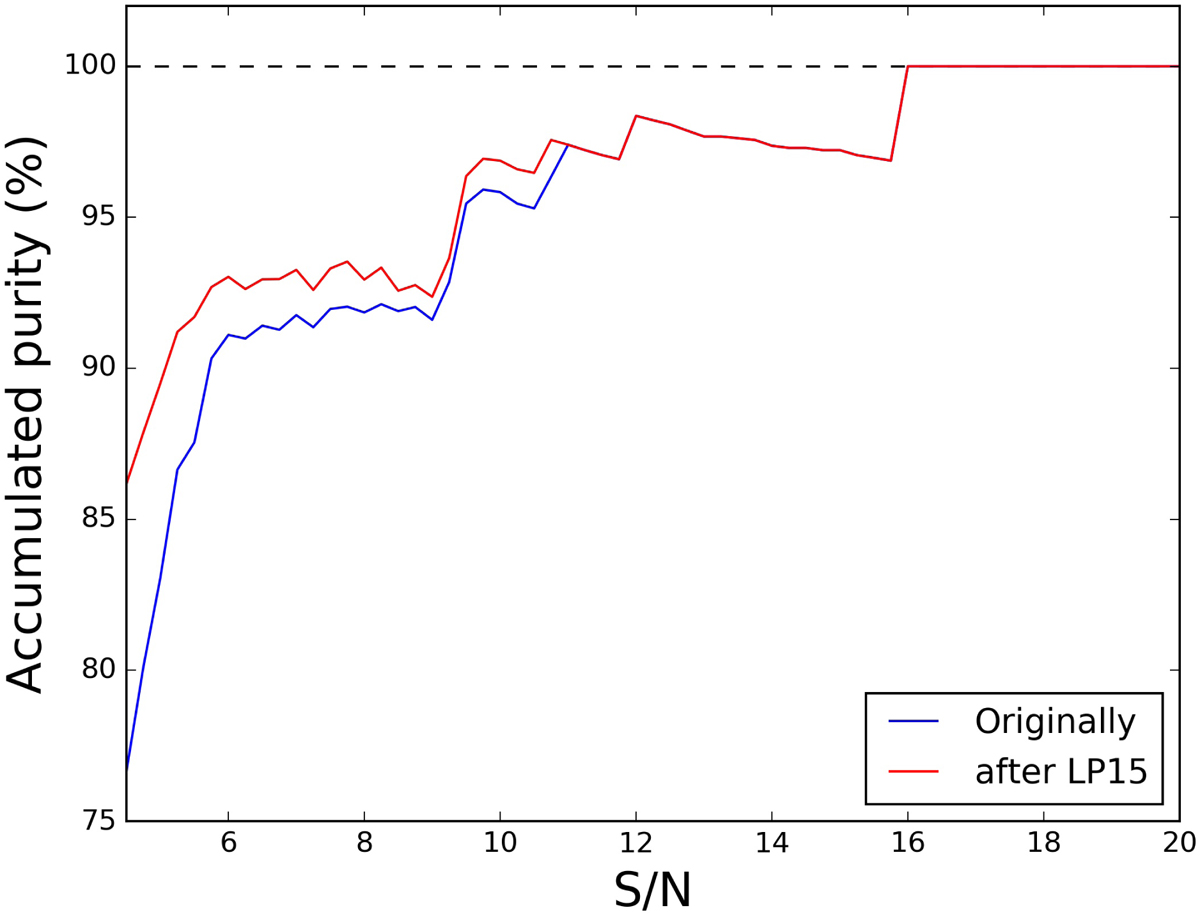
Accumulated purity of the PSZ2-North sample (Dec > −15°) studied as a function of the S/N, i.e., the percentage of the sources that are actual clusters and related to the SZ signal. In blue we represent the original purity of the catalog, and in red the same purity, but after this work.
Current usage metrics show cumulative count of Article Views (full-text article views including HTML views, PDF and ePub downloads, according to the available data) and Abstracts Views on Vision4Press platform.
Data correspond to usage on the plateform after 2015. The current usage metrics is available 48-96 hours after online publication and is updated daily on week days.
Initial download of the metrics may take a while.