Fig. 11.
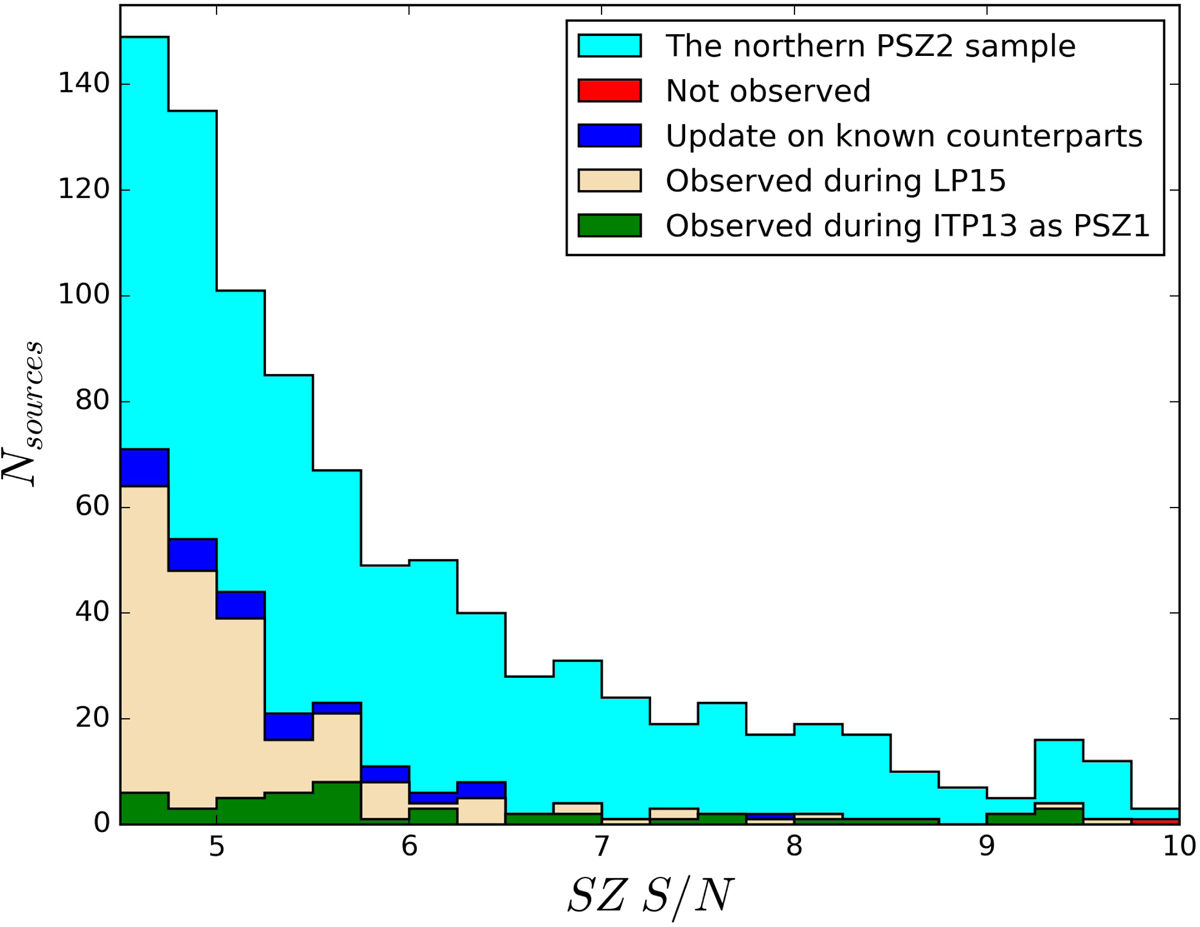
PSZ2 cluster counts as a function of the S/N of the SZ detection. The PSZ2-North sample is represented in light blue, the sources that are still not observed are represented in red (< 0.5%), the updated sources described in Sect. 5 are shown in dark blue (3.4%), and the sources that were originally not confirmed and were observed during LP15 and ITP13 are shown in green (18.4% and 4.8%, respectively). The bin size is 0.25.
Current usage metrics show cumulative count of Article Views (full-text article views including HTML views, PDF and ePub downloads, according to the available data) and Abstracts Views on Vision4Press platform.
Data correspond to usage on the plateform after 2015. The current usage metrics is available 48-96 hours after online publication and is updated daily on week days.
Initial download of the metrics may take a while.