Fig. 5.
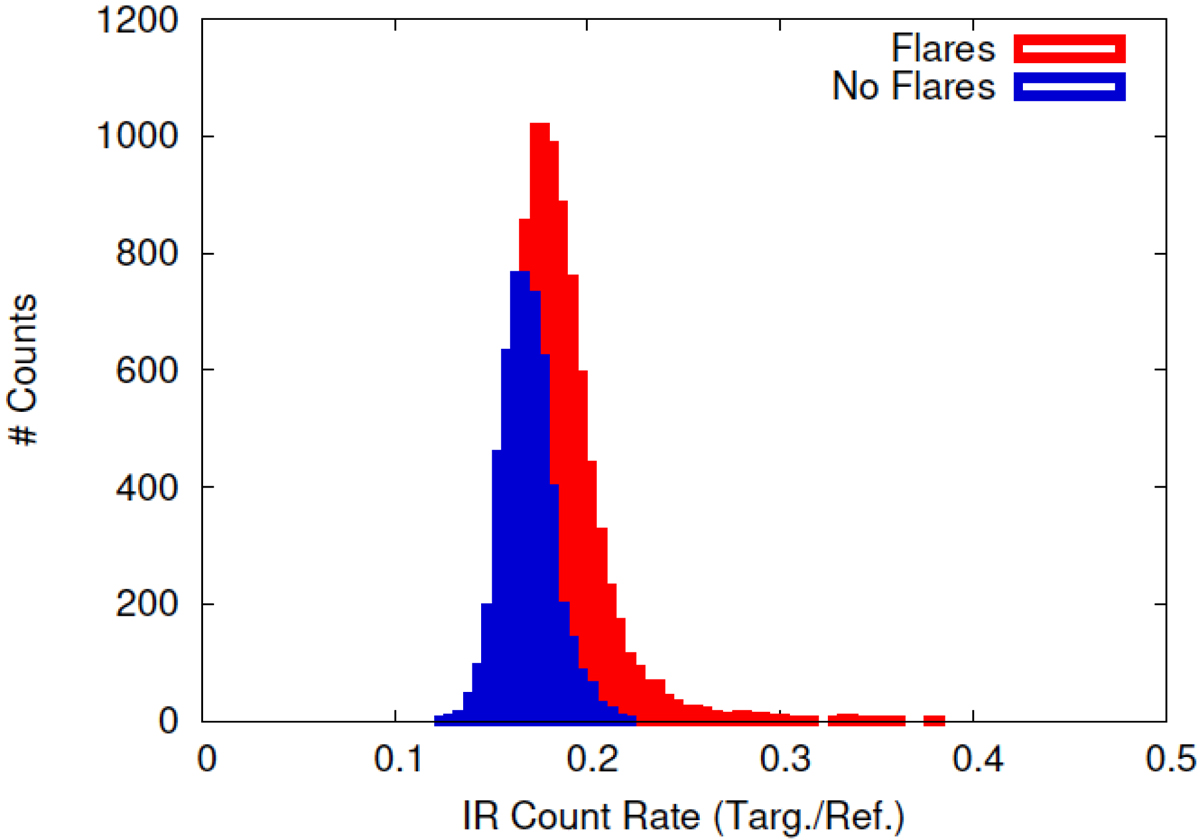
Near-infrared light-curve distribution of the two regimes. In red we present the first more variable segment and in blue we plot the most stable segment. Gaussian fits of the two distributions give reduced χ2 of 1.2 and 4.4 in the quiet and flare part of the light curve with 19 and 29 degrees of freedom, respectively, in accordance with the asymmetry of the flaring part distribution, which is also visible by eye.
Current usage metrics show cumulative count of Article Views (full-text article views including HTML views, PDF and ePub downloads, according to the available data) and Abstracts Views on Vision4Press platform.
Data correspond to usage on the plateform after 2015. The current usage metrics is available 48-96 hours after online publication and is updated daily on week days.
Initial download of the metrics may take a while.