Free Access
Fig. 4.
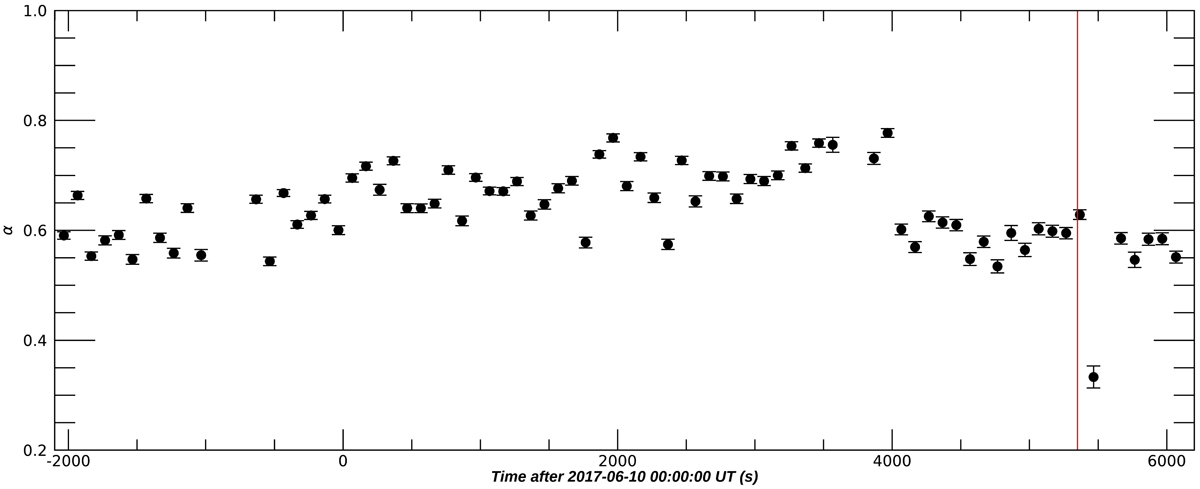
Trend with time of the slope α of the optical and NIR spectral energy distribution of PSR J1023, defined as in Eq. (1). The solid red line indicates the exact time of the low-high X-ray transition. The bin time of the curve is 100 s. Errors are represented at the 68% confidence level.
Current usage metrics show cumulative count of Article Views (full-text article views including HTML views, PDF and ePub downloads, according to the available data) and Abstracts Views on Vision4Press platform.
Data correspond to usage on the plateform after 2015. The current usage metrics is available 48-96 hours after online publication and is updated daily on week days.
Initial download of the metrics may take a while.