Fig. 3.
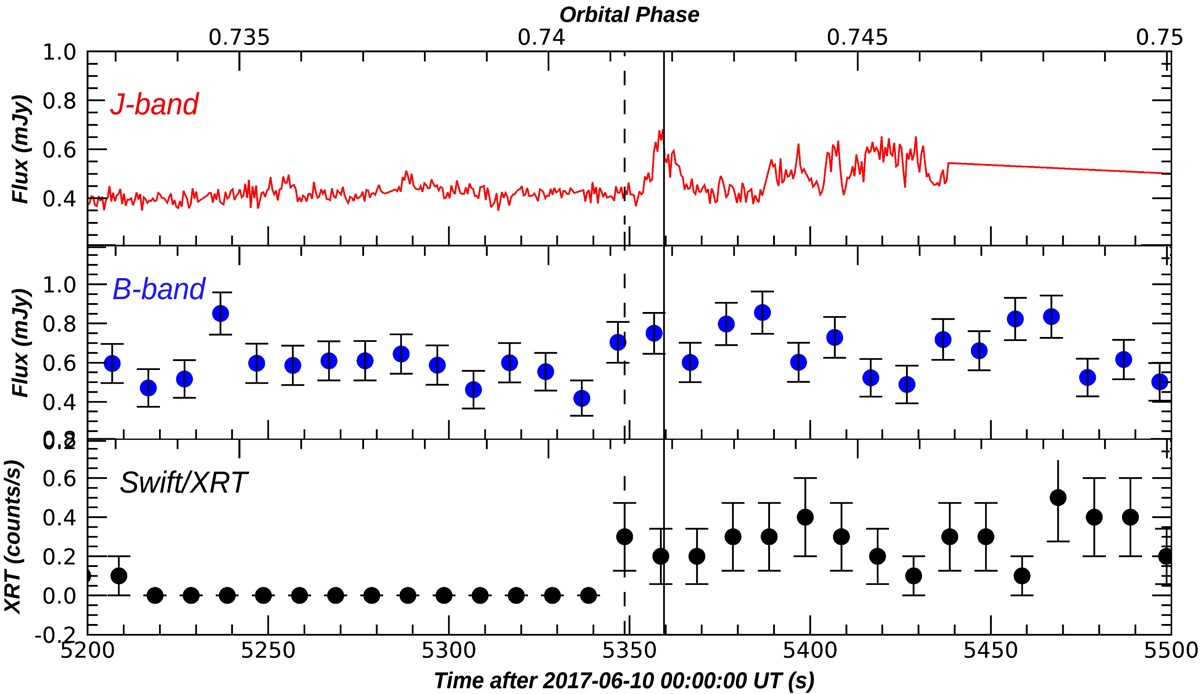
From top to bottom, zoom of the NIR, optical, and X-ray (Swift/XRT) light curves of J1023 around the time of the X-ray low-high transition. With the dashed black line we indicate the exact time of the transition and with the solid black line we show the time corresponding to the centroid of the NIR flare. The top x-axis reports the orbital phases of the system, which have been evaluated starting from the ephemeris of Archibald et al. (2009), phase 0 being the inferior conjunction of the companion star.
Current usage metrics show cumulative count of Article Views (full-text article views including HTML views, PDF and ePub downloads, according to the available data) and Abstracts Views on Vision4Press platform.
Data correspond to usage on the plateform after 2015. The current usage metrics is available 48-96 hours after online publication and is updated daily on week days.
Initial download of the metrics may take a while.