Fig. 8
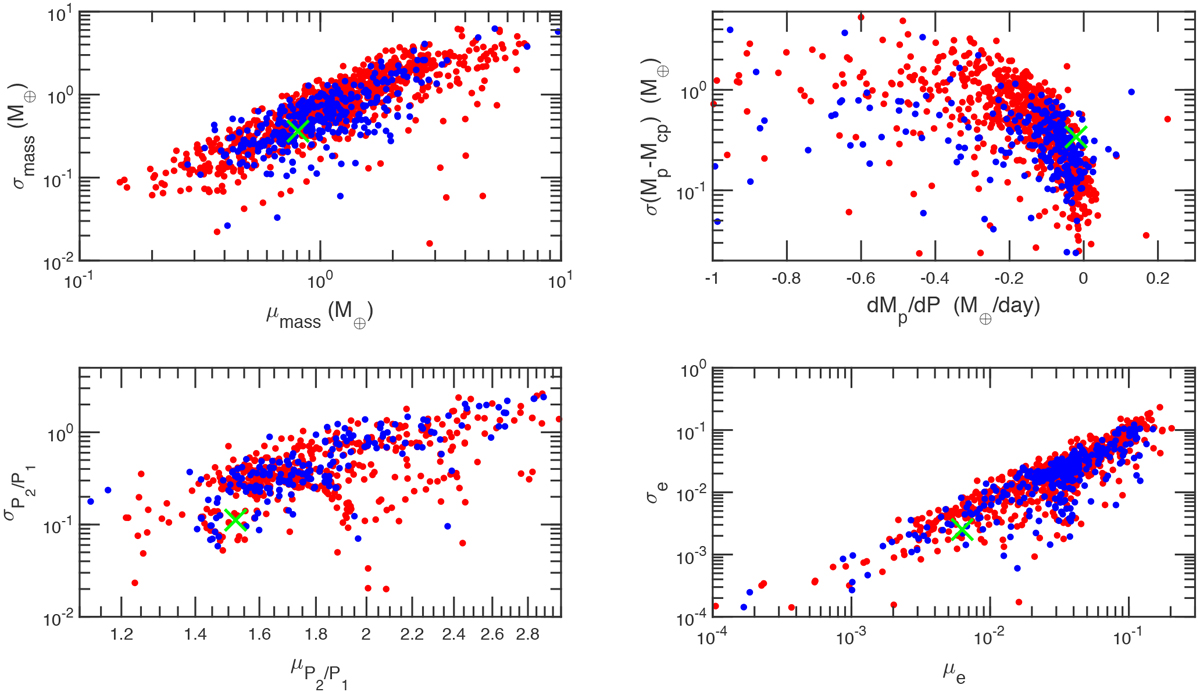
Different components contributing to the similarity criterion (Eq. (11)) for systems formed by pebble accretion (red points) and planetesimal accretion (blue points). The green crosses denote the respective values for the Trappist-1 system. Top left panel: mean planet mass versus dispersion of the planet mass. Bottom left panel: mean period ratios between neighbouring planets versus their dispersion. Top right panel: assuming that the gradient of mass as a function of period follows y = mx+ c, the panel shows the average gradient as a component (dmp∕dP), along with the dispersion of masses compared to their expected masses using the calculated straight line equation. Bottom right panel: mean planet mass versus dispersion of the planet mass. All components only take into account planets withperiods less than 20 days.
Current usage metrics show cumulative count of Article Views (full-text article views including HTML views, PDF and ePub downloads, according to the available data) and Abstracts Views on Vision4Press platform.
Data correspond to usage on the plateform after 2015. The current usage metrics is available 48-96 hours after online publication and is updated daily on week days.
Initial download of the metrics may take a while.