Fig. 17
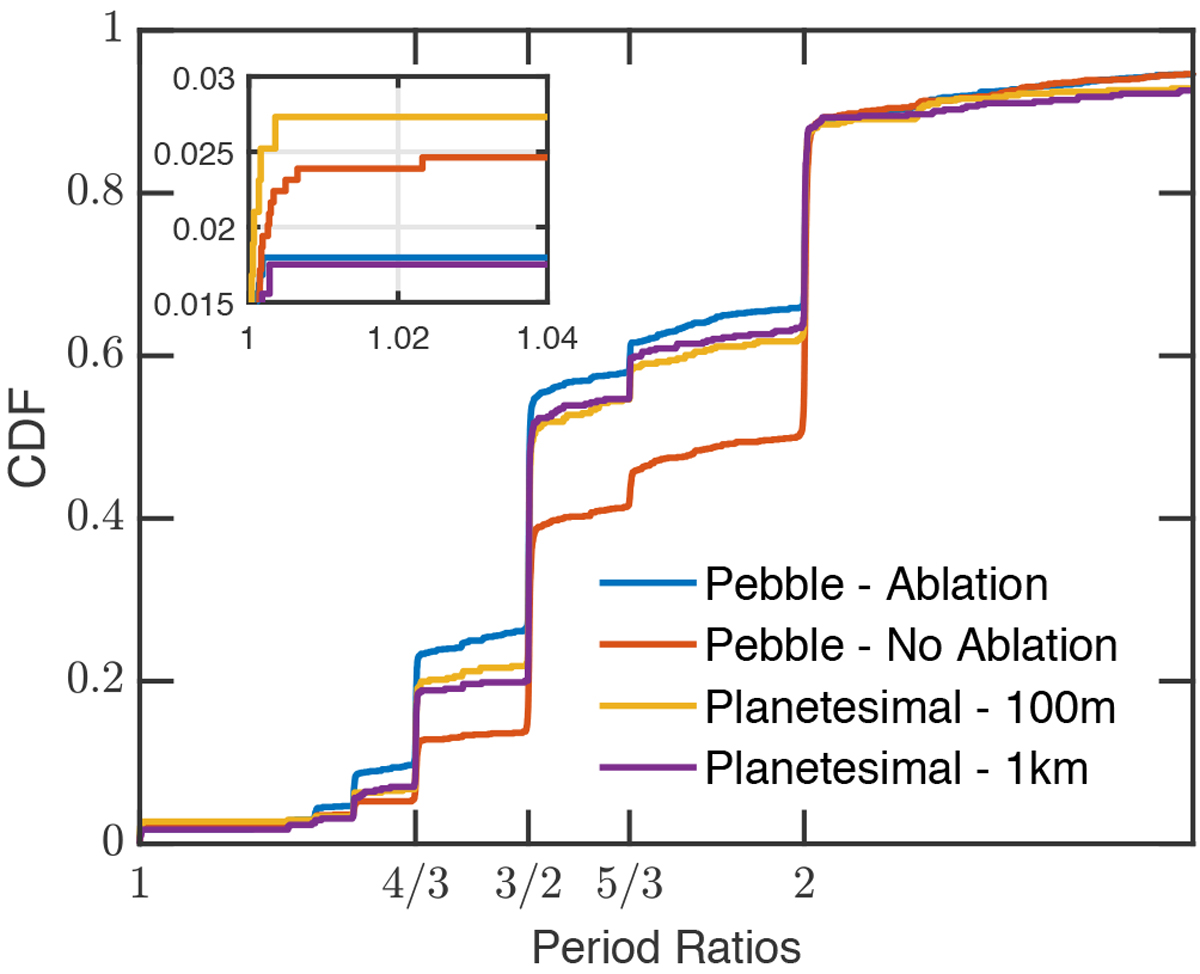
Cumulative distribution functions of period ratios between neighbouring planets with periods less than 20 days. Blue and red lines show the period ratios for pebble accretion simulations that include and do not include the effects of ablation. The yellow and purple lines show the period ratios for the planetesimal accretion scenario for the planetesimals of size 100 m and 1 km, respectively. The inset plot zooms in on the coorbital region of the distributions.
Current usage metrics show cumulative count of Article Views (full-text article views including HTML views, PDF and ePub downloads, according to the available data) and Abstracts Views on Vision4Press platform.
Data correspond to usage on the plateform after 2015. The current usage metrics is available 48-96 hours after online publication and is updated daily on week days.
Initial download of the metrics may take a while.