Fig. 15
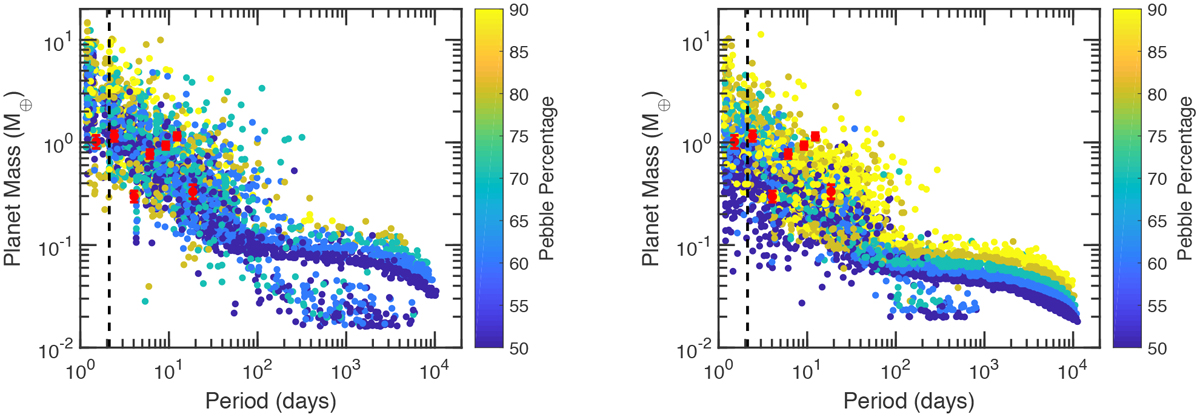
Mass versus period plots showing the surviving simulated planets from the pebble accretion scenario. Marker colour denotes the percentage of solids that is comprised of pebbles. Red markers denote the masses and periods of the observed Trappist-1 planets with error bars (Grimm et al. 2018). Left panel: mass versus period diagram for simulations not including the effects of pebble ablation. Right panel: effects of pebble ablation.
Current usage metrics show cumulative count of Article Views (full-text article views including HTML views, PDF and ePub downloads, according to the available data) and Abstracts Views on Vision4Press platform.
Data correspond to usage on the plateform after 2015. The current usage metrics is available 48-96 hours after online publication and is updated daily on week days.
Initial download of the metrics may take a while.