Fig. 12
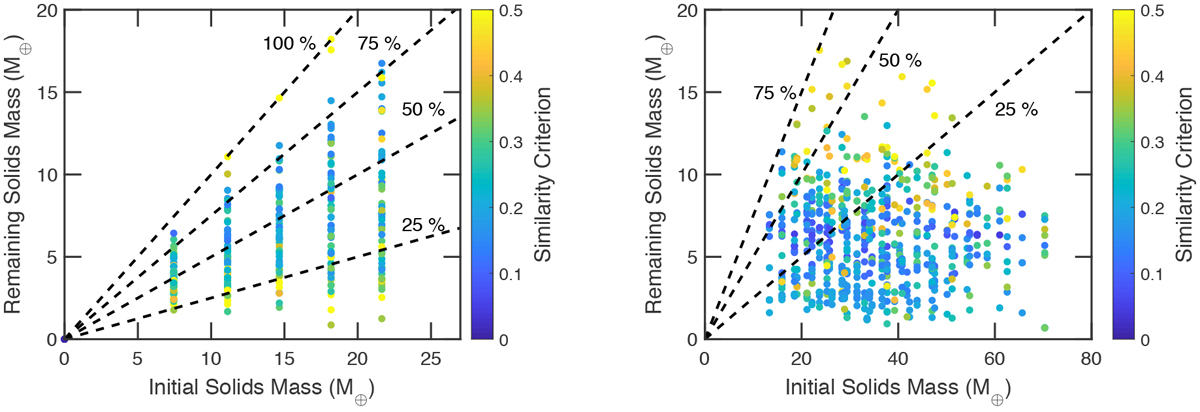
Mass of solids remaining at the end of each simulation as a function of the initial solid mass. Simulations from the planetesimal accretion scenario are shown in the left panel whilst those from the pebble accretion scenario are shown in the right panel. All solids lost include those that have been ejected from the system and lost to the central star. The dashed linesshow the 25, 50, 75 and 100% margins. The colour coding in both panels corresponds to similarity criterion (Eq. (11)).
Current usage metrics show cumulative count of Article Views (full-text article views including HTML views, PDF and ePub downloads, according to the available data) and Abstracts Views on Vision4Press platform.
Data correspond to usage on the plateform after 2015. The current usage metrics is available 48-96 hours after online publication and is updated daily on week days.
Initial download of the metrics may take a while.