Fig. 8
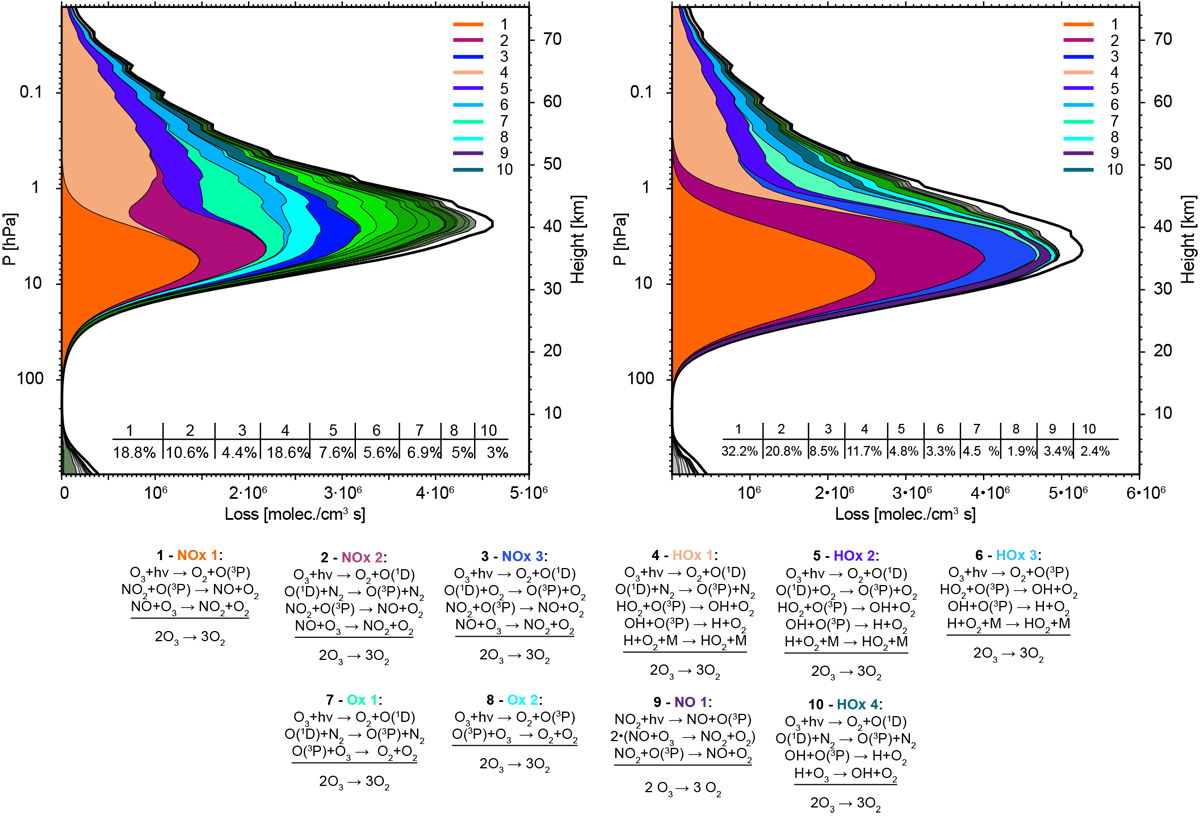
Ozone loss cycles determined by PAP corresponding to scenario 1 (quiescent Sun, left panel) and scenario 2(GLE05, right panel) are shown on a linear scale from the surface to the mid mesosphere (~75 km). Please note that the figures show all pathways with a percentage contribution above 0.01% and that only the ten most important pathways are tabulated in the subpanel.
Current usage metrics show cumulative count of Article Views (full-text article views including HTML views, PDF and ePub downloads, according to the available data) and Abstracts Views on Vision4Press platform.
Data correspond to usage on the plateform after 2015. The current usage metrics is available 48-96 hours after online publication and is updated daily on week days.
Initial download of the metrics may take a while.