Fig. 6
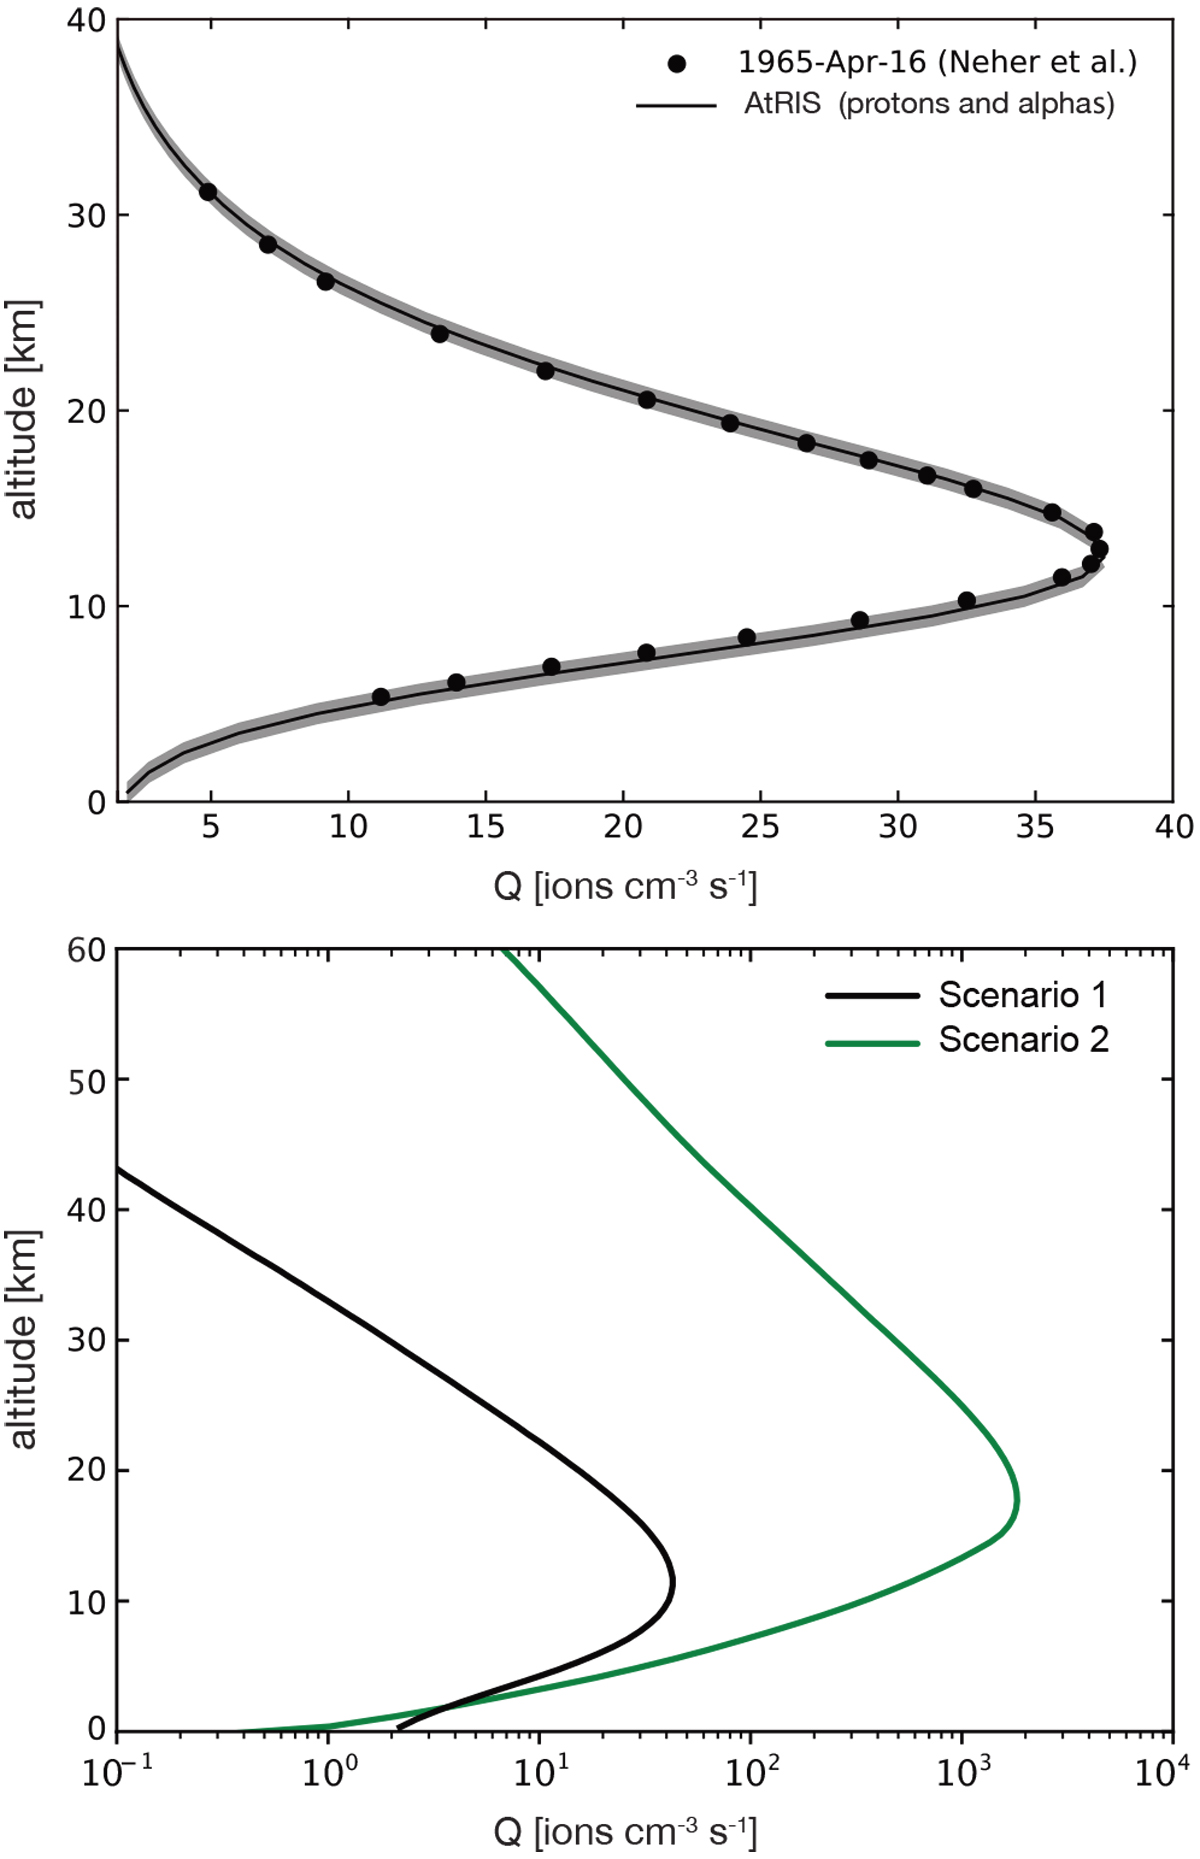
Upper panel: validation of the modeled GCR-induced ion-pair production rates (solid line) against balloon measurements performed by Neher (1971) (dots, see Banjac et al. 2019a, for further validation). Lower panel: CR-induced atmospheric ionization for scenario 1 (quiescent Sun) and scenario 2 (GLE05) displayed as black and green curves, respectively. As can be seen, differences of up to three orders of magnitude occur.
Current usage metrics show cumulative count of Article Views (full-text article views including HTML views, PDF and ePub downloads, according to the available data) and Abstracts Views on Vision4Press platform.
Data correspond to usage on the plateform after 2015. The current usage metrics is available 48-96 hours after online publication and is updated daily on week days.
Initial download of the metrics may take a while.