Fig. 8
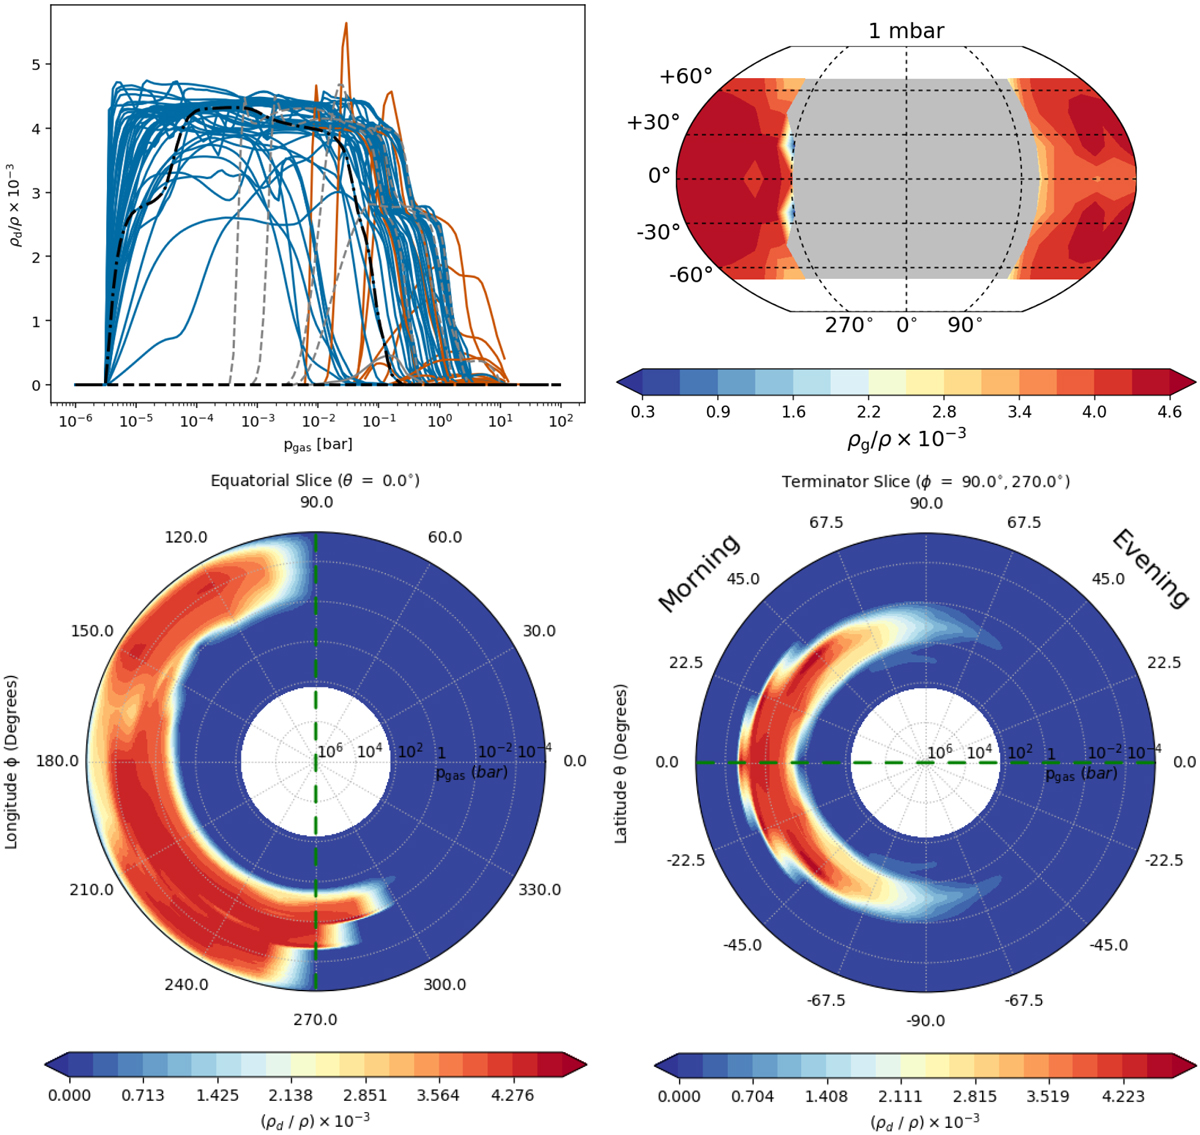
Global distribution of the cloud particle load in term of the dust-to-gas mass ratio ρd ∕ρgas on HAT-P-7b. The color coding is the same as Fig. 3: the day-side profiled are shown inred, the night-side profiles in blue, the black dashed-dot line is the anti-stellar point (ϕ, θ) = (180deg, 0deg). Top right: dust-to-gas mass ratio as a function of pgas (bar) of the probed 97 profiles. Top left: global maps at pgas = 10−2 bar. Bottom left:2D cut through the equatorial plane. Bottom right: 2D cut along the terminator. The slice plot cut-off is at ρd ∕ρgas = 10−3. The dashed green lines indicate where these two slice plots overlap. For the viewing geometry of the slice plots in the bottom row,please see Fig. A.2.
Current usage metrics show cumulative count of Article Views (full-text article views including HTML views, PDF and ePub downloads, according to the available data) and Abstracts Views on Vision4Press platform.
Data correspond to usage on the plateform after 2015. The current usage metrics is available 48-96 hours after online publication and is updated daily on week days.
Initial download of the metrics may take a while.