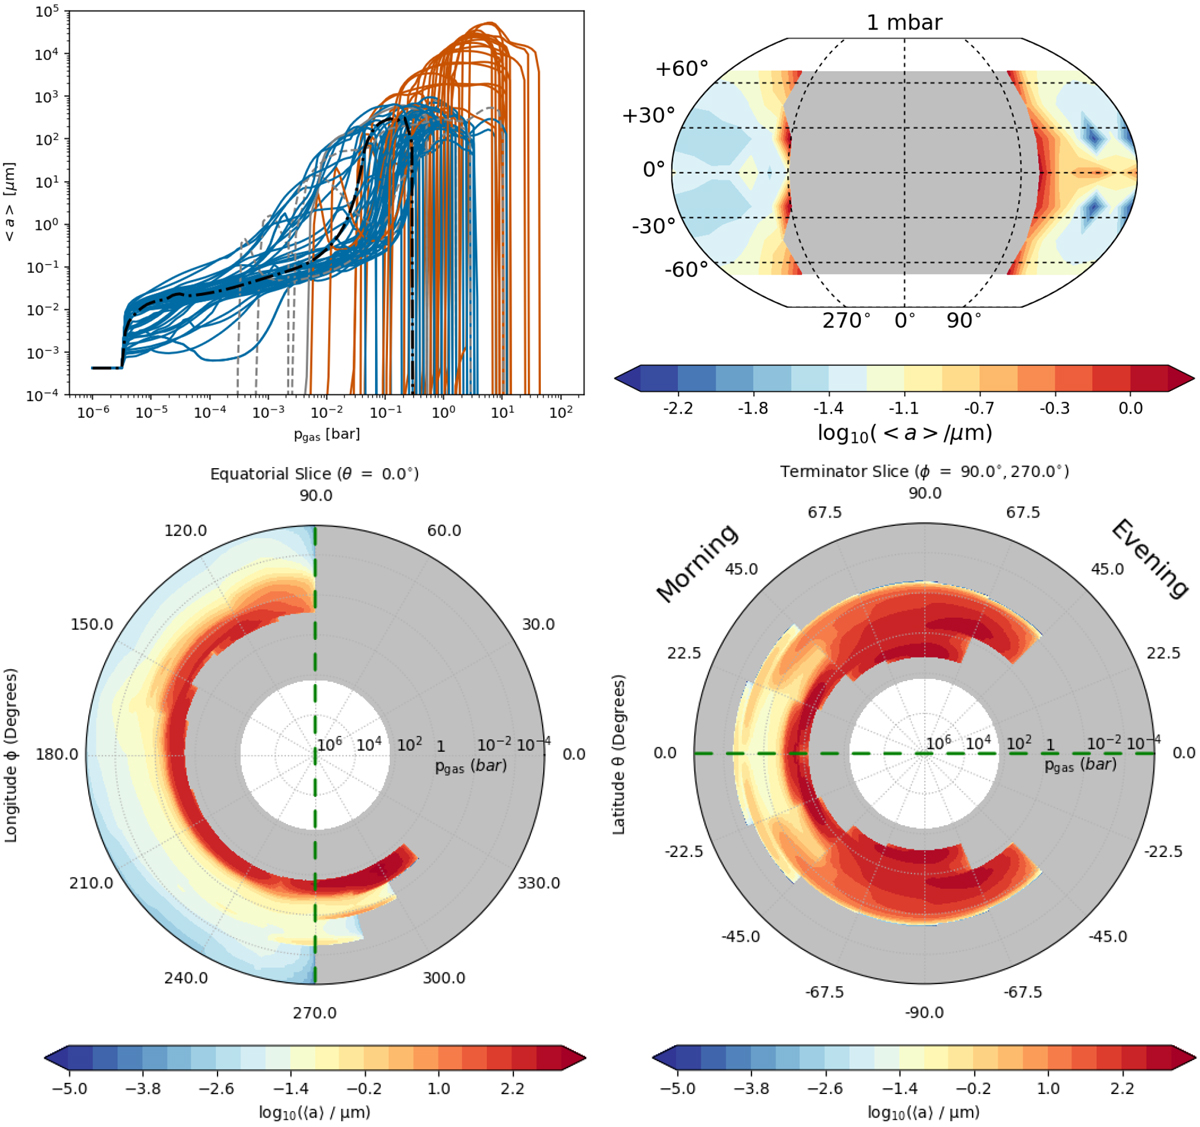
Fig. 7
Global distribution of mean cloud particle sizes ⟨a⟩ in micronson HAT-P-7b. The color coding is the same as in Fig. 3: the day-side profiles are shown in red, the night-side profiles in blue, the black dot-dashed line is the anti-stellar point (ϕ, θ) = (180deg, 0deg). Top left: 1D structures as function of (pgas) [bar] of the probed 97 profiles. Top right: global 2D map of mean particle size shows that sub-micron cloud particle dominates the night-side atmosphere at pgas = 10−2 bar. Bottom left: 2D cut through the equatorial plane. Bottom right: 2D cut along the terminator. The slice plots’ cut of is at ⟨a⟩ = 10−5 (μm). The dashed green lines indicate where these two slice plots overlap. For the viewing geometry of the slice plots in the bottom row,please see Fig. A.2.
Current usage metrics show cumulative count of Article Views (full-text article views including HTML views, PDF and ePub downloads, according to the available data) and Abstracts Views on Vision4Press platform.
Data correspond to usage on the plateform after 2015. The current usage metrics is available 48-96 hours after online publication and is updated daily on week days.
Initial download of the metrics may take a while.