Fig. 4
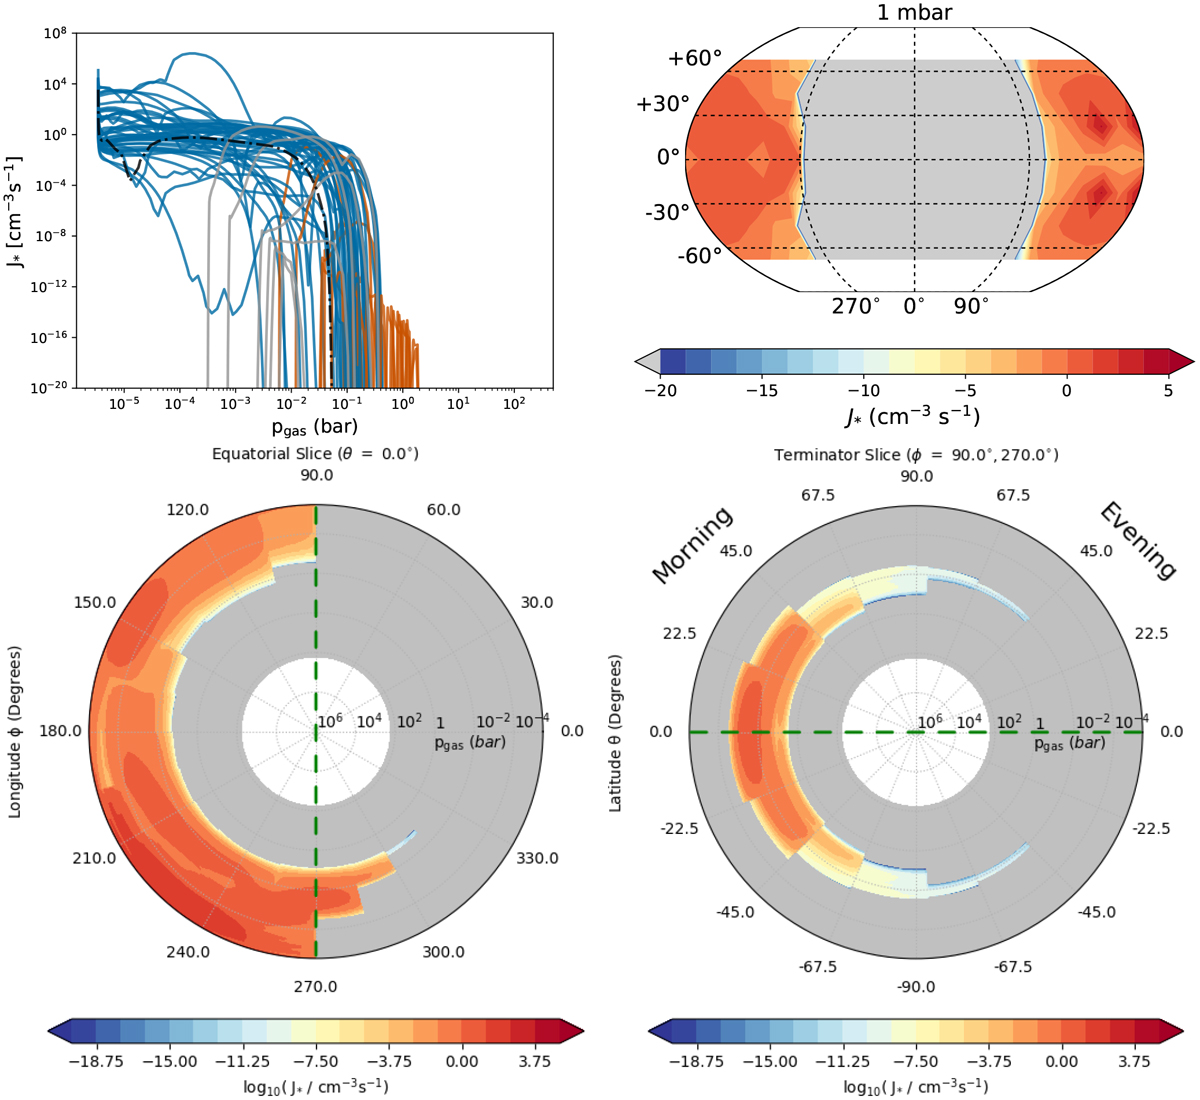
Global distribution of the total nucleation rate, J* (cm−3 s−1) (J* = ΣJi, i = TiO2, SiO, C) that triggers cloud formation on HAT-P-7b. Top left: 1D J* structure as function of pgas (bar) forthe probed 97 profiles (red – dayside, blue – nightside, orange – evening terminator (ϕ = 90deg)), light blue – morning terminator (ϕ = 270deg), black dot-dashed – antistellar point (ϕ = 180deg). Top right: global 2D maps at pgas = 10−2 bar. Bottom: 2D cut through the equatorial plane. The smallest value shown in the slice plots is 10−20 (cm−3 s−1). The dashed green lines indicate where these two slice plots overlap. For the viewing geometry of the slice plots in the bottom row,please see Fig. A.2.
Current usage metrics show cumulative count of Article Views (full-text article views including HTML views, PDF and ePub downloads, according to the available data) and Abstracts Views on Vision4Press platform.
Data correspond to usage on the plateform after 2015. The current usage metrics is available 48-96 hours after online publication and is updated daily on week days.
Initial download of the metrics may take a while.