Fig. 3
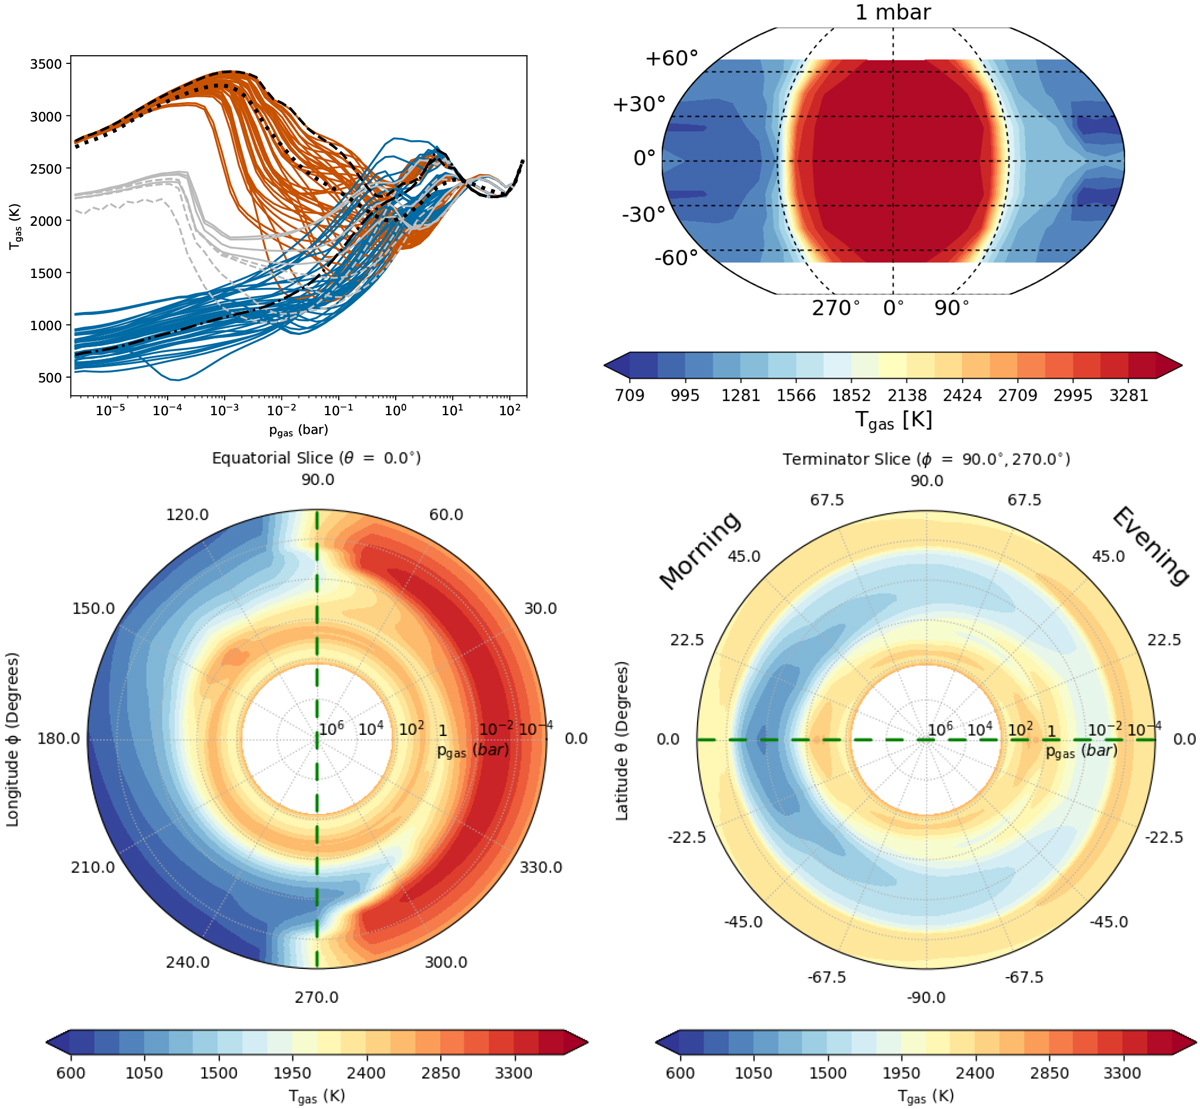
Global gas temperature, Tgas (K), distribution on HAT-P-7b. Top left: 1D structures as function of pgas (bar) of the probed 97 profiles (red – dayside (ϕ = 60deg … 0deg… 300deg)), blue – nightside (ϕ = 120deg … 240deg), orange – evening terminator (ϕ = 90deg), light blue – morning terminator (ϕ = 270deg), black dashed– substellar point (ϕ = 0deg), black dot-dashed – antistellar point (ϕ = 180deg). The dotted black line represents a dayside-average profile (using an average weighted by the projected area that is observed in secondary eclipse). Top right: global 2D maps at pgas = 10−3 bar. The 2D temperature maps visualise the strong day-night differences and also the somewhat inhomogeneous nightside ((θ, ϕ) = (±22.5deg, 165deg), (±22.5deg, 180deg)). These local temperature minima (ΔTgas ≈ 200 K to surrounding) will have an effect on our subsequent analysis results. Bottom left: 2D cut through the equatorial plane. Bottom right: 2D cut along the terminator. The dashed green lines indicate where these two slice plots overlap. For the viewing geometry of the slice plots in the bottom row, please see Figs. 3, A.2.
Current usage metrics show cumulative count of Article Views (full-text article views including HTML views, PDF and ePub downloads, according to the available data) and Abstracts Views on Vision4Press platform.
Data correspond to usage on the plateform after 2015. The current usage metrics is available 48-96 hours after online publication and is updated daily on week days.
Initial download of the metrics may take a while.