Fig. A.1
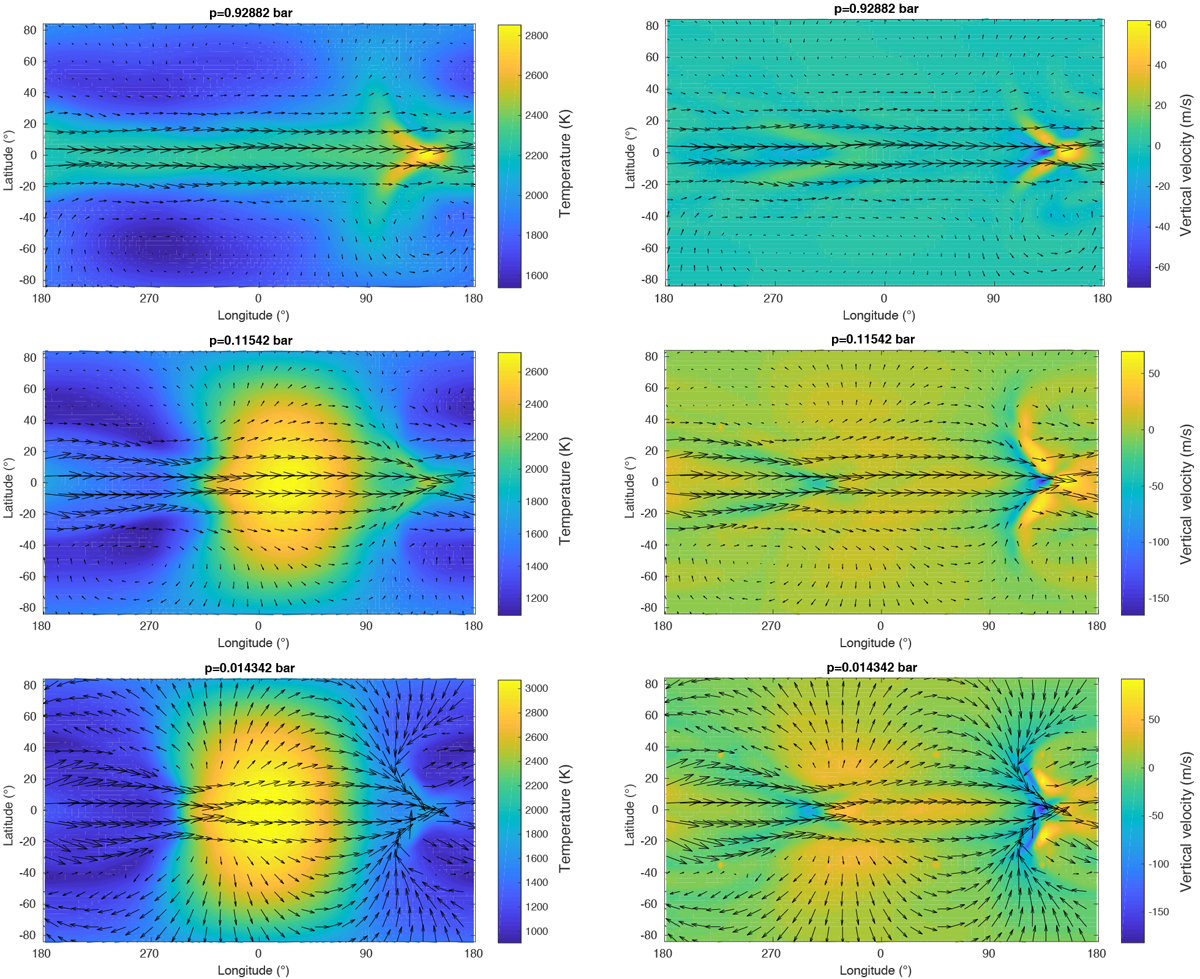
Numerical data of the 3D GCM atmosphere simulations for HAT-P-7b according to Sect. 2.4 at ≈1 bar, 0.1 bar and 0.01 bar. Left: gas temperature (colour coded) and horizontal velocity (arrows). Right: vertical (colour coded) and the horizontal (arrows) velocity components. These are the original numerical data from which we extract the 97 1D profiles shown Fig. 3. The velocity field (right) shows the equatorial jet, the global-scale overturning circulation with upwelling on the dayside and downwelling on the nightside, i.e. a global Hadley-cell like large-scale vertical velocity components.
Current usage metrics show cumulative count of Article Views (full-text article views including HTML views, PDF and ePub downloads, according to the available data) and Abstracts Views on Vision4Press platform.
Data correspond to usage on the plateform after 2015. The current usage metrics is available 48-96 hours after online publication and is updated daily on week days.
Initial download of the metrics may take a while.