Fig. 21
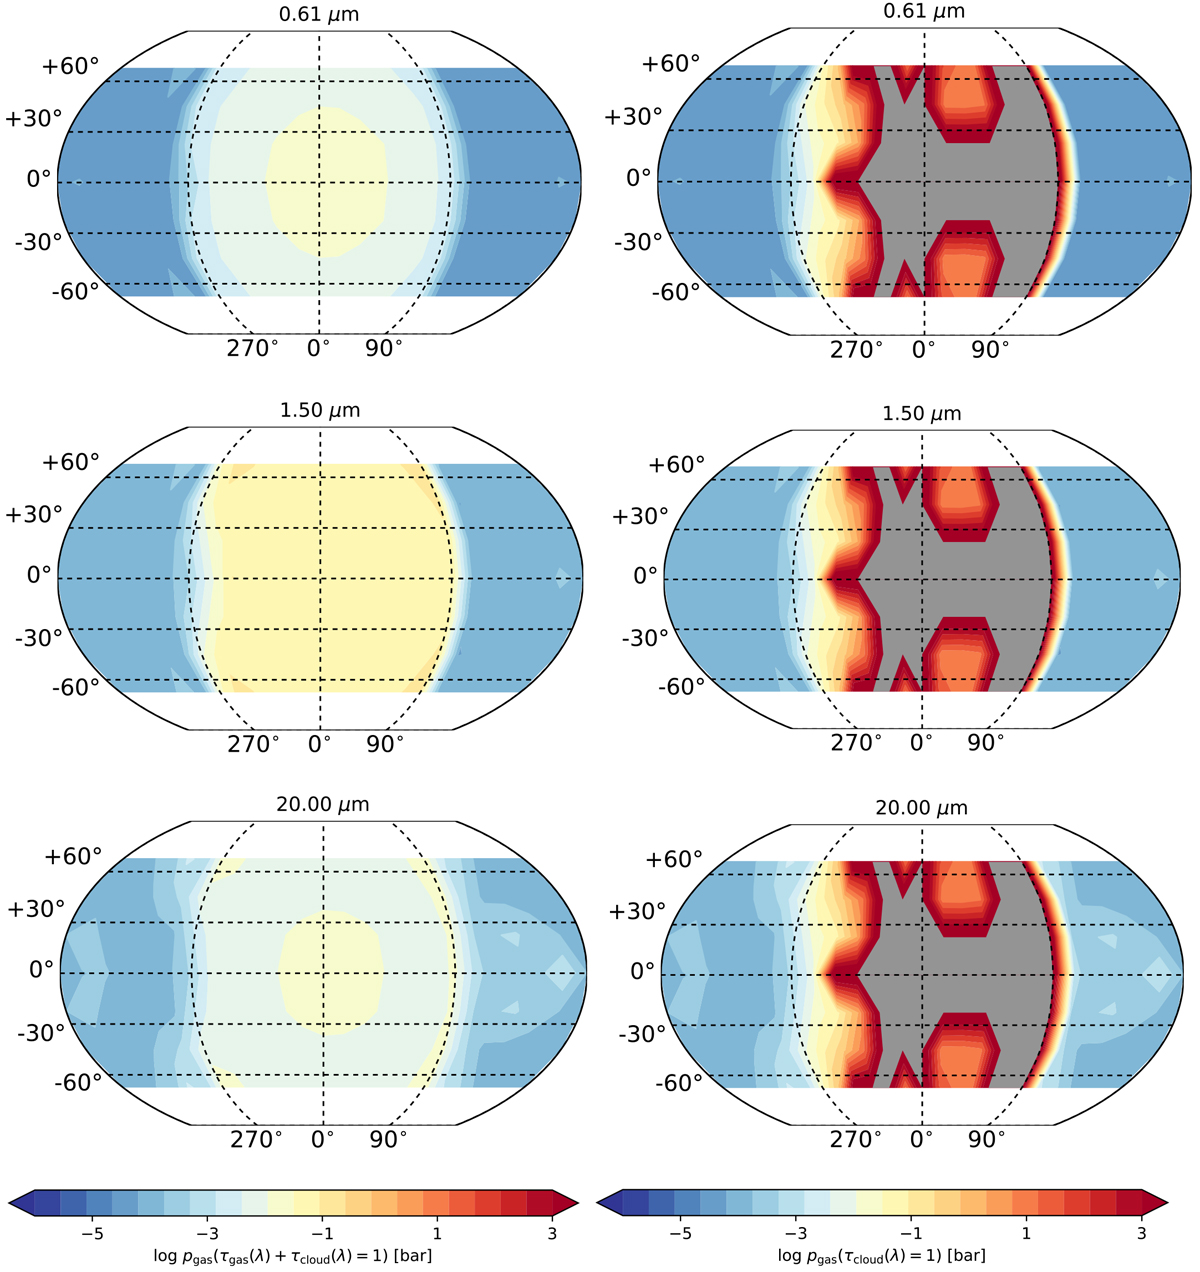
Pressure levels, log(pgas/(bar)), where the atmosphere becomes optically thick at several distinct wavelengths: the optical (0.6 μm, top), infrared (1.5 μm, middle), andmid-infrared (20 μm, bottom). The left side shows the gas pressure level at which τcloud(λ) + τgas(λ) = 1. The right side shows the same but for τcloud(λ) = 1 only. Because there are no clouds near the equator on the dayside, the map shows the highest pressure layer used in the simulation (100 bar).
Current usage metrics show cumulative count of Article Views (full-text article views including HTML views, PDF and ePub downloads, according to the available data) and Abstracts Views on Vision4Press platform.
Data correspond to usage on the plateform after 2015. The current usage metrics is available 48-96 hours after online publication and is updated daily on week days.
Initial download of the metrics may take a while.