Fig. 20
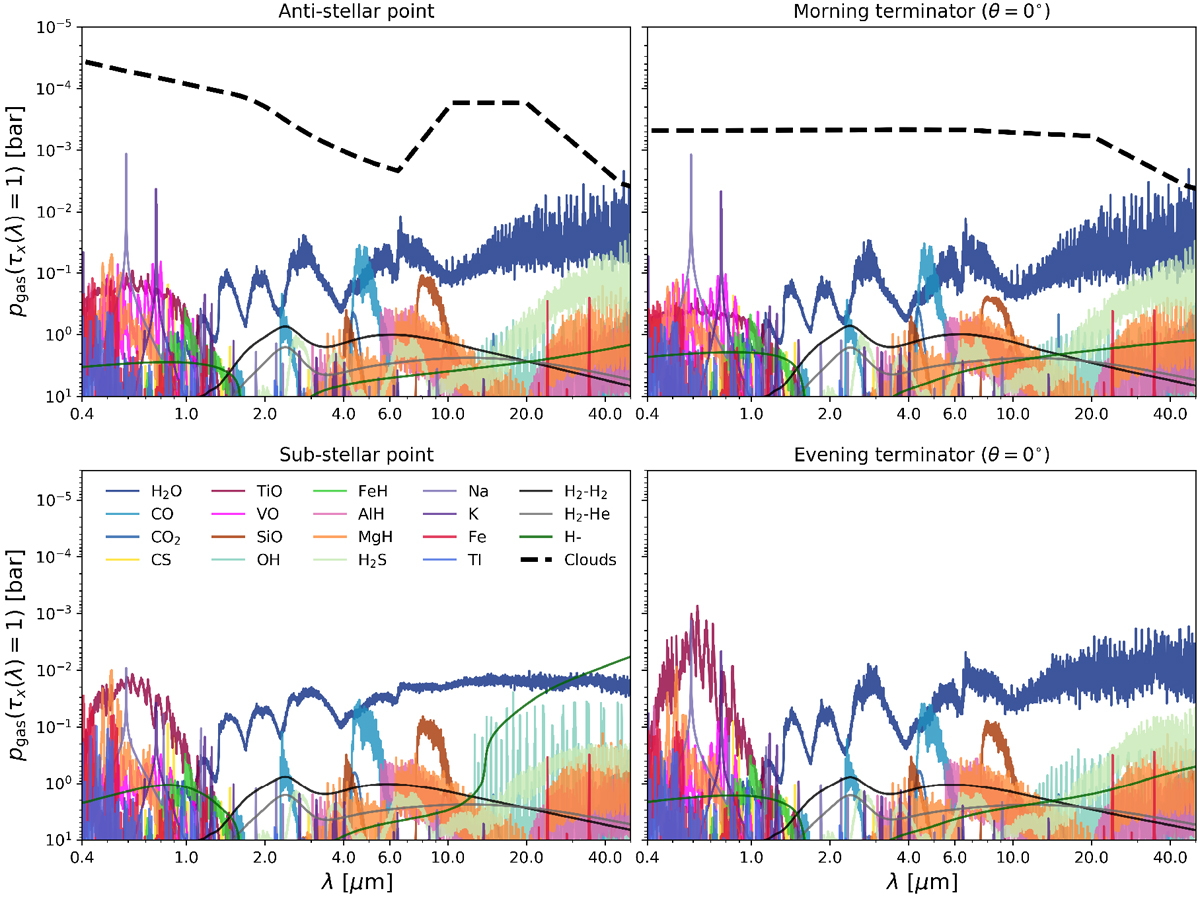
Prominent sources of gas-phase opacity. The atmospheric gas pressure, pgas (bar), at which the vertical wavelength-dependent optical depth, τx(λ), of species x reaches unity is shown for λ = 0.4 … 50 μm. All gas phase opacities are plotted at a spectral resolution of R = 1000. Four equatorial regions are considered: (i) the anti-stellar point (ϕ, θ) = (180°, 0°), (ii) the morning terminator (ϕ, θ) = (270°, 0°), (iii) the sub-stellar point (ϕ, θ) = (0°, 0°), and (iv) the evening terminator (ϕ, θ) = (90°, 0°). In regions containing clouds, we also show the atmospheric pressure where the cloud becomes optically thick, i.e. τcloud (λ) = 1, for comparison. The gas pressure at which the atmosphere of HAT-P-7b becomes optically thick varies by orders of magnitude between clear and cloudy regions.
Current usage metrics show cumulative count of Article Views (full-text article views including HTML views, PDF and ePub downloads, according to the available data) and Abstracts Views on Vision4Press platform.
Data correspond to usage on the plateform after 2015. The current usage metrics is available 48-96 hours after online publication and is updated daily on week days.
Initial download of the metrics may take a while.