Fig. 18
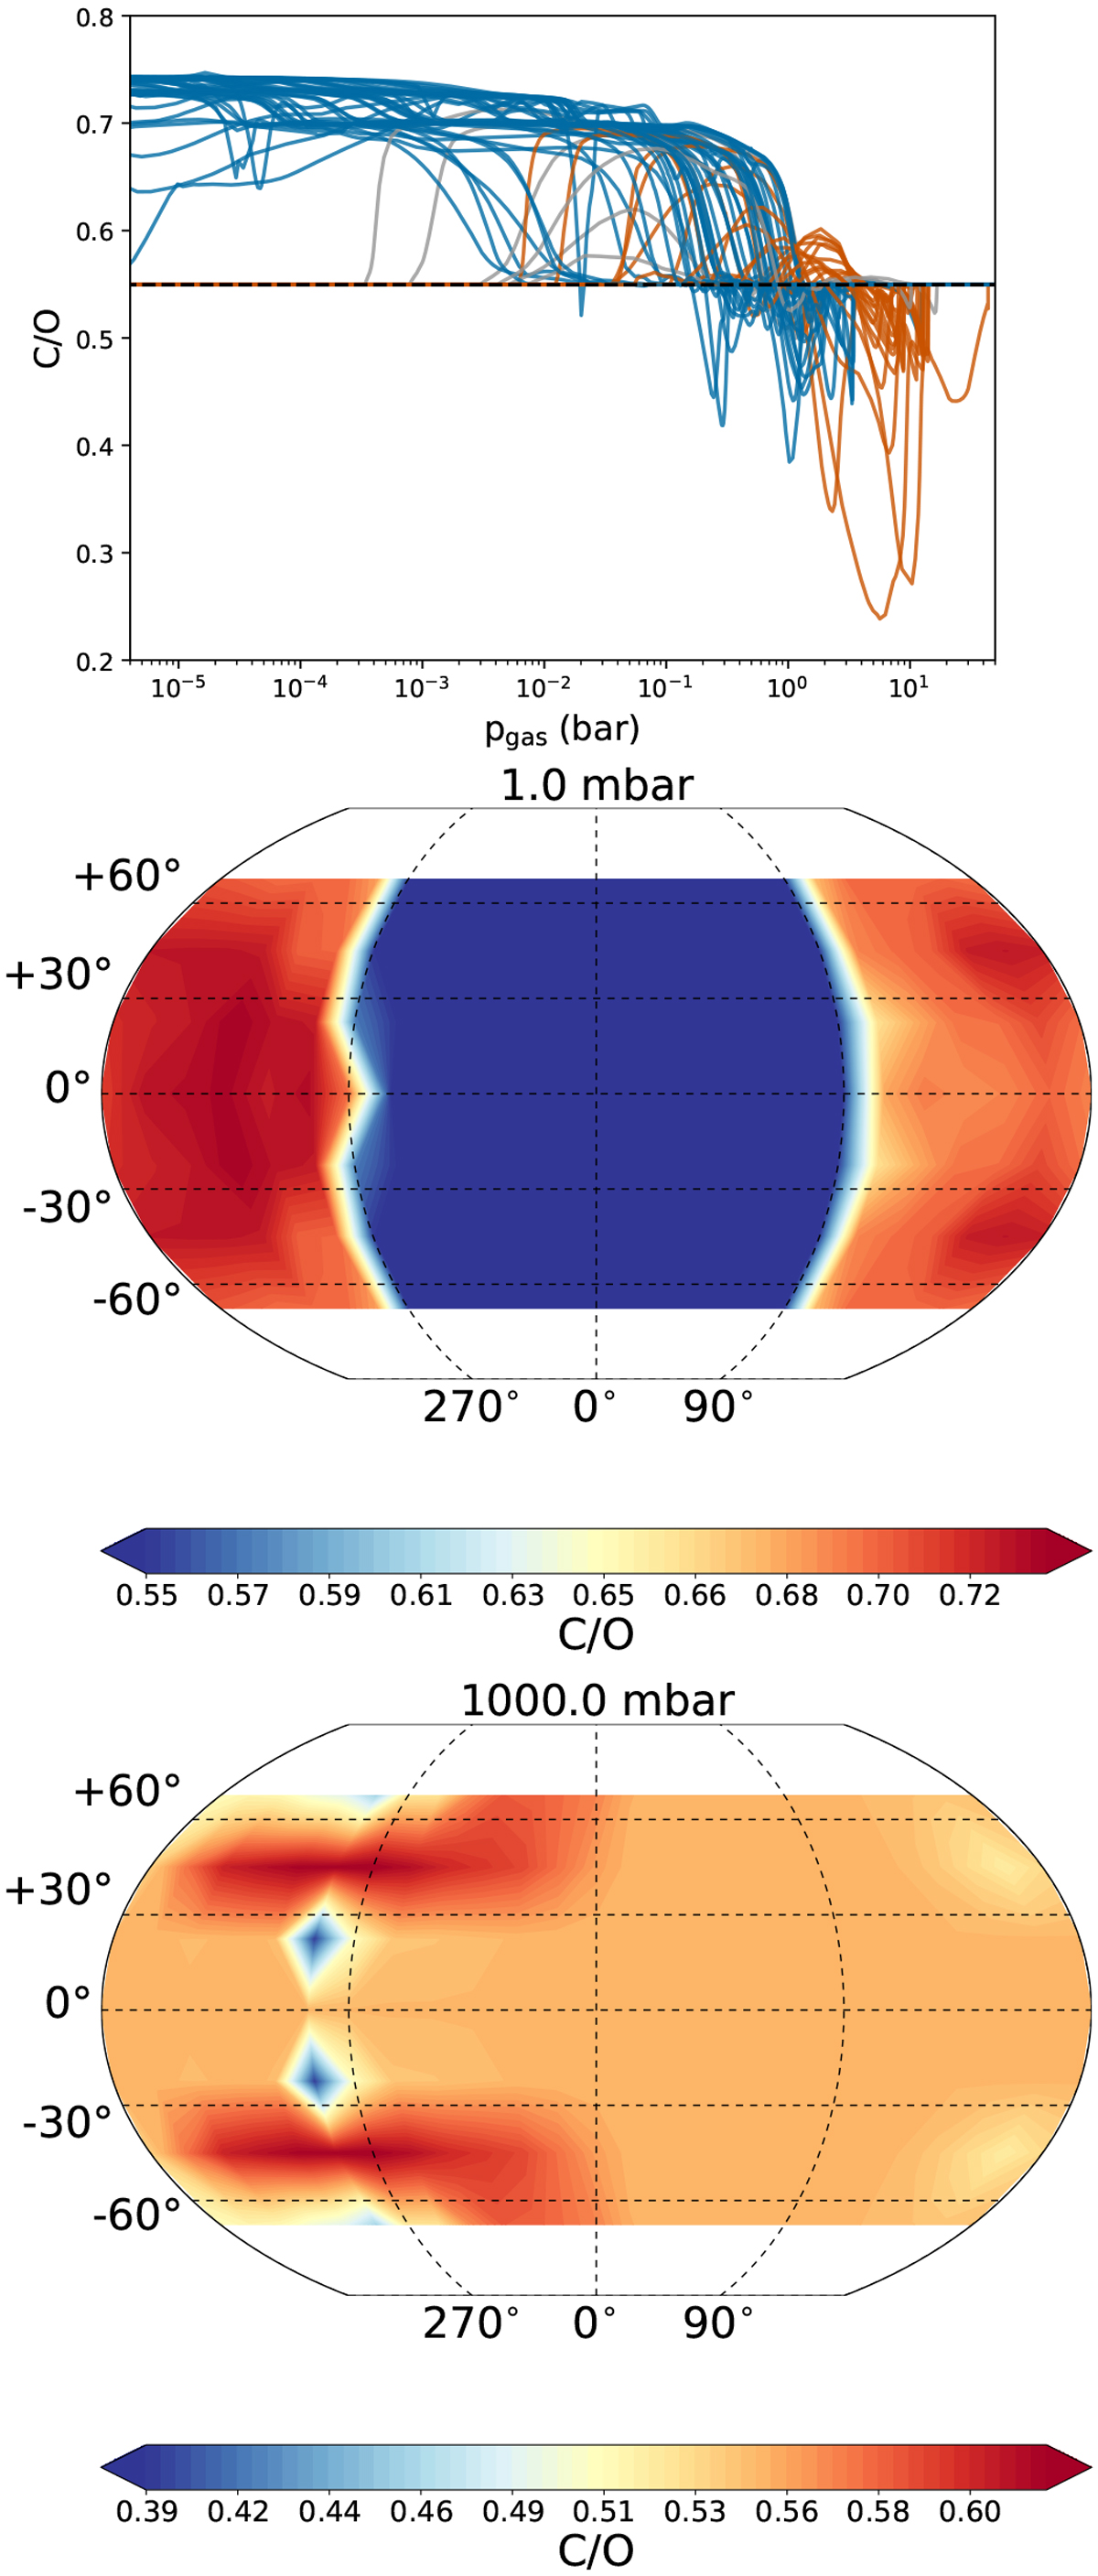
Global gas-phase C/O after cloud formation. Top: all 1D profiles (line color code as in Fig. 3). The black horizontal dash line represents the solar value C/O ~0.54. Middle: 2D map at 1 bar, bottom: 2D map at 1 mbar. The dayside C/O is consistent with solar, whereas the nightside shows an enhancement of C/O (~ 0.7) due to oxygen depletion by cloud formation. Deep atmospheric layers may have C/O ~0.25 due to oxygen enrichment from evaporating cloud particles.
Current usage metrics show cumulative count of Article Views (full-text article views including HTML views, PDF and ePub downloads, according to the available data) and Abstracts Views on Vision4Press platform.
Data correspond to usage on the plateform after 2015. The current usage metrics is available 48-96 hours after online publication and is updated daily on week days.
Initial download of the metrics may take a while.